Blogs review: the productivity-compensation wedge and the mark-up puzzle
What’s at stake: While our understanding of the origins of the productivity – median compensation wedge – that is, the fact that real median hourly wages in the US have remained close to stagnant over the past 3 decades – progresses, a new puzzling fact has recently been uncovered for which we still have few good explanations: that most of the inflation in nonfarm business prices during the past decade has been due to a rise in the price markup over unit labor costs rather than to rising unit labor costs in the US. After reviewing these two facts, we discuss the extent to which they reflect the same underlying developments.
The productivity - median compensation wedge
Lawrence Mishel has a recent paper on this issue for the Economic Policy Institute. During the 1973 to 2011 period, labor productivity rose 80.4 percent but real median hourly wage increased 4.0 percent, and the real median hourly compensation (including all wages and benefits) increased just 10.7 percent. If the real median hourly compensation had grown at the same rate as labor productivity over the period, it would have been $32.61 in 2011 (2011 dollars), considerably more than the actual $20.01 (2011 dollars). Consequently, the conventional notion that increased productivity is the mechanism by which living standards increases are produced must be revised to this: productivity growth establishes the potential for living standards improvements and economic policy must work to reconnect pay and productivity.
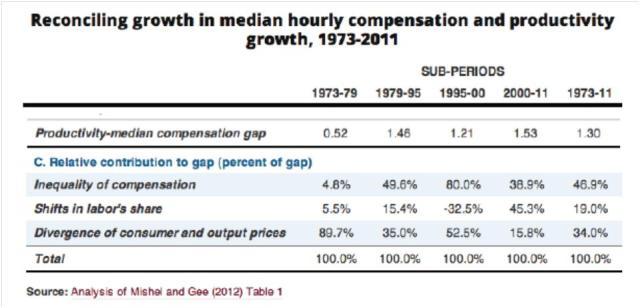
Paul Krugman writes that it’s two-thirds the inequality, stupid. One third of the difference is due to a technical issue involving price indexes. The rest, however, reflects a shift of income from labor to capital and, within that, a shift of labor income to the top and away from the middle. What this says is that widening inequality makes a huge difference. Income stagnation does not reflect overall economic stagnation; the incomes of typical workers would be 30 or 40 percent higher than they are if income inequality hadn’t soared.
The price mark-up puzzle
The 2012 Economic Report of the President dug up another related but somewhat different puzzle for the US in the 2000s (note that the wedge between productivity and median compensation has been growing for the last 30 years not just the last 10). According to the report, “most of the inflation in nonfarm business prices during the past four years has been due to a rise in the price markup over unit labor costs rather than to rising unit labor costs.”
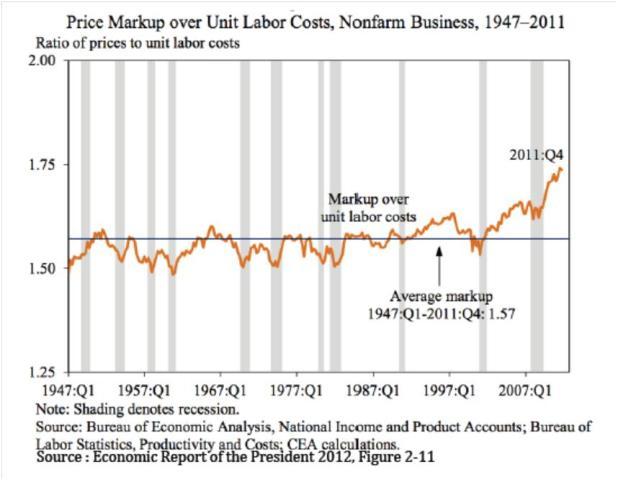
Nominal hourly compensation has risen at a roughly 2.3 percent annual rate during the four years since the business-cycle peak in December 2007, but this growth has been mostly offset by growth of labor productivity at an annual rate of about 1.7 percent during the same period, leaving unit labor costs essentially unchanged. Historically, prices of nonfarm business output have risen in a roughly parallel fashion to unit labor costs, so the markup of prices relative to unit labor costs has been flat. As can be seen in Figure 2-11, this long-term property of the U.S. economy appears to have broken down over the past decade or arguably even as early as the mid 1990s. The markup has now risen to its highest level in post–World War II history, with much of that increase taking place over the past four years.
If you want to reproduce the diagram from the Council of Economic Advisors’ ERP, Menzie Chinn has a useful do it yourself guide.
Shifts in price mark-ups and labor shares
The Economic Report of the President concludes that “because the markup of prices over unit labor costs is the inverse of the labor share of output, saying that an increase in the price markup is the highest in postwar history is equivalent to saying that the labor share of output has fallen to its lowest level.” In turn, the labor share can decline due to either lower compensation per hour worked, or due to less labor required to produce a given level of output. The latter is mostly driven by technological changes in the production structure of advanced economies, and is thus not necessarily a negative development from a welfare standpoint.
The markup puzzle is indeed picking up some of the declining labor share, but not only. In particular, notice that ULC=nominal hourly compensation/hourly productivity (see the OECD for more on these definitions) and that nominal compensation has been growing faster than productivity in the US over the past 2 decades at least. This implies ULC has been growing (with the exception of the last 4 years since the start of the Great Recession), not declining, and hence the rise of the markup ratio from the early 2000s to 2007 cannot be explained by a decline in the denominator of the mark-up-ULC ratio. Rather, it must be that the profit share (as defined below) is growing faster than labor costs (note the ratio can be expressed either as price of output/ULC or equivalently as total profits/total labor compensation).
Given this, there are several possible factors other than a declining labor share that may have driven the markup/unit labor cost ratio over the past decade especially:
The ratio could be partially driven by compensation inequality at the firm level between managerial and non-managerial compensation, since stock options are not fully included in the BLS measure of labor compensation. In particular, they happen to be included only once exercised. Non-exercised stock options (a rising item in executive compensation) could have thus played a role. This relates to the idea of a shift in bargaining power in the labor market. Michel Dumont, Glenn Rayp, and Peter Willemé as well as Lourdes Moreno and Diego Rodríguez Moreno have, for example, recent papers differentiating the rise of bargaining power by high-skilled workers due to the preeminence of R&D versus a decline in bargaining power by low-skilled workers driven by increasing global market competition.
The ratio could also be driven by what Jesus Felipe and Utsav Kumar call "unit capital costs", the ratio of nominal profit rate to capital productivity. The markup over labor compensation ratio is intrinsically misleading because the numerator does not equal firm operating profits. In fact, it includes gross value added before taxes and financing costs. Rising debt or equity costs, as well as increases in the tax burden, could therefore also play a role. Harris Della and Ana Fernandes discuss theoretical channels through which increased financial sector concentration could drive up markup indexes in non-financial product markets by tightening financing constraints in financially dependent sectors.