On the efficacy of internal devaluations: answers to the questions of Kevin O’Rourke
Kevin O’Rourke kindly drew attention at http://www.irisheconomy.ie/ to my recent Bruegel Policy Contribution titled “Compositional effects on productivity, labour cost and export adjustments” and asked four questions. In my answer I would like to show some charts – but as I cannot post charts at the Irish Economy blog, I post these charts at Bruegel Blog.
Question 1: What happens when you calculate a composition-adjusted real exchange rate index for Ireland vis à vis other eurozone members only?
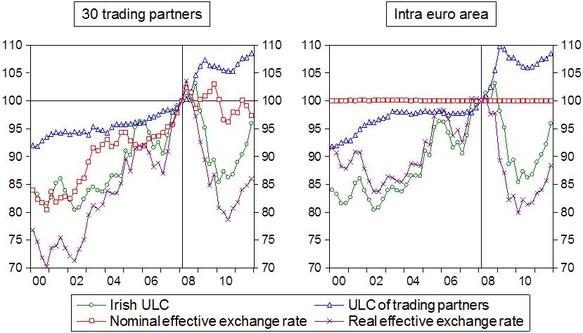
Figure 1 below shows that since 2008Q1, the difference between the developments of the real effective exchange rate (REER) calculated against euro-area partners only and 30 trading partners is not large: the former depreciated by 12 percent, the latter by 14 percent. In both cases the increase in unit labour costs (ULC) of trading partners played a major role, in addition to Irish ULC falls. The nominal effective exchange rate is constant by definition against euro-area partners and had limited role when considering 30 trading partners.
There is a more significant difference between the intra-euro and the total REER when we look at the 2000-2008 period, largely due to the appreciation of the euro from about 2002.
Note that the 30 countries I consider comprise 85 percent of Irish trade. The distribution within these 30 countries is the following: euro-area 39 percent, UK 22 percent, US 23, Japan 7 percent, others 9 percent.
Figure 1: Business sector excluding agriculture, construction and real estate activates: main components of the Irish unit labour costs based real effective exchange rate (using constant weights; 2008Q1=100), 2000Q1-2011Q4
Question 2. What happens if you include agriculture in the index? This is an important traded sector in the Irish context.
Question 3. What happens if you do both 1 and 2?
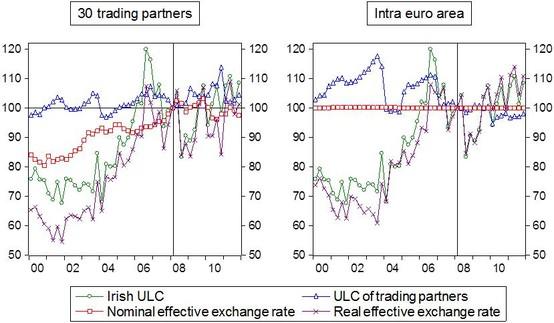
Let me respond to both questions by showing the REER and its components for the agriculture alone (Figure 2). The data looks noisy, yet after a temporary decline in 2008-2009, the REER has appreciated somewhat (just a cumulative 1 percent if we consider 30 trading partners, but 11 percent when considering euro-area partners only). Therefore, for the business sector the cumulative REER depreciation from 2008Q1 to 2011Q4 is somewhat less if agriculture is included, but not much less, because the share of agriculture in the value added of the business sector excluding construction and real estate was only about 2.5 percent.
Figure 2: Agriculture: main components of the Irish unit labour costs based real effective exchange rate (2008Q1=100), 2000Q1-2011Q4
Question 4. One of the most striking graphs in the paper is Figure 2 on p. 6, which shows that while manufacturing value added has risen by 30 percent since the start of 2008 (thanks to what happened in the pharmaceutical sector), gross production has only risen by 5 percent. Can we make further progress in understanding this discrepancy (there are some helpful suggestions in the paper), and what might this tell us about the movement in Irish unit labour costs and real exchange rates since the crisis began?
Unfortunately, I cannot add more observations on the reasons for the discrepancy – and even acknowledge that the four possible explanations listed in my paper were suggested by the Irish economists I thank on the cover page.
But I can highlight that the assessment of this issue is severely hindered by the lack of publicly available data. Ireland is among the few EU countries for which manufacturing sub-sectoral gross value added is available only in current prices, but not in constant prices (I used Eurostat data). Constant price value added data is available only for the total manufacturing industry and therefore one cannot assess the discrepancy between vale added and gross production at the sub-sectoral level.
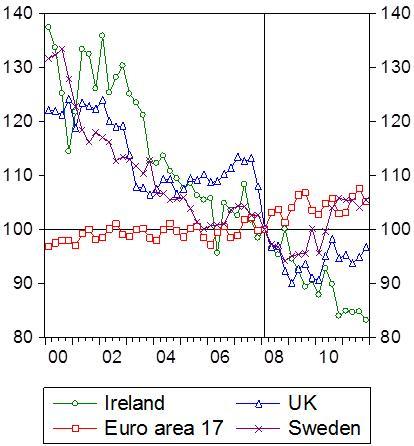
Deflators may also play a role (the fourth item listed in my paper), which, consequently, also cannot be assessed at the sub-sectoral level. For the total manufacturing Figure 3 compares the deflators of some countries. The deflators of Ireland, Sweden and the UK showed a similar pre-crisis pattern, which very much differed from the euro-area total – but at least Ireland is not unique in this regard (and deflators are certainly impacted by the sub-sectoral composition of manufacturing).
Since 2008Q1 Irish manufacturing prices fell the most and the trend is in line with the pre-crisis trend. In the UK and Sweden the depreciation of the nominal exchange rate may have contributed to the fall in the deflator. And in Sweden the deflator went up recently, in line with the appreciation of the nominal exchange rate.
Understanding the reasons for the developments of the Irish manufacturing deflator – and having data for sub-sectoral deflators – would help a lot in answer Question 4 of Kevin O’Rourke.
Figure 3: Deflator of total manufacturing value added (2008Q1=100), 2000Q1-2011Q4
Finally, since several bloggers commented public sector wages, also asking what happened in southern euro-area members, let me show a chart on this as well. The left-hand panel of Figure 4 suggests that public servants in Ireland are well paid compared to other sectors of the Irish economy, apart from financials. (Btw, Irish real estate agents take home little, at least as reflected in official statistics.) The right hand panel shows that Irish public servants earn much more per hour than their colleagues in southern Europe, yet Ireland has a much higher income per capita as well, which explain at least part of the difference. Public sector wages declined significantly in Greece from the peak in 2009, yet in all four countries public sector wages are broadly at their late 2007 levels.
Figure 4: Hourly labour compensation (€ per hour), 2000Q1-2011Q4
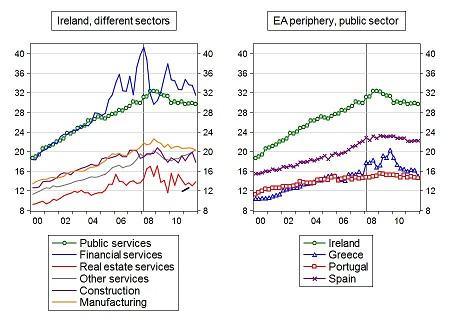
Note: hourly labour compensation was calculated as the ratio of total labour compensation to total hours worked, as reported in the national accounts database of Eurostat.
About the authors
Related content

The impact on the European Union of Ukraine’s potential future accession
This report evaluates the impact on the EU of a possible EU accession of Ukraine, focusing on economic consequences and institutional developments.

The EU needs a methodology for including reform impacts in fiscal trajectories
Such a methodology, and a governance mechanism for managing associated risks, must be in place before the new fiscal framework kickstarts in September

Real effective exchange rates for 178 countries: a new database

Emerging countries have replaced most of Russia’s lost trade with advanced economies
Russian trade overall seems to have suffered little from sanctions; meanwhile, medicine and food trade continues with sanctioning countries