Has the U.S. outperformed the euro area due to inflation since 2007?
The nominal GDP growth differential between the U.S. and the euro area is striking: taking the latest forecasts of the European Commission into accoun
The nominal GDP growth differential between the U.S. and the euro area is striking: taking the latest forecasts of the European Commission into account, the U.S. outpaced the euro area by 9 percentage points in 2008-2013.
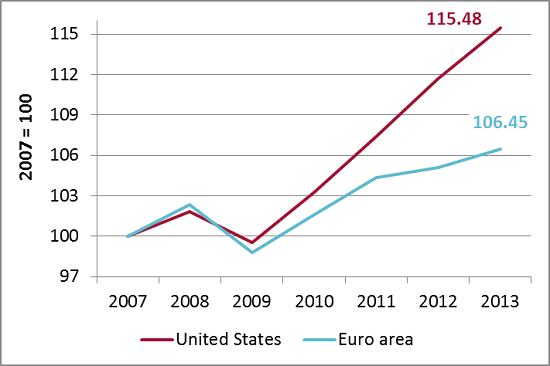
Figure 1: Nominal GDP.
Source: AMECO database.
While both economies contracted similarly in the midst of the financial crisis, the U.S. experienced a much stronger recovery in the years thereafter. In particular since 2012, the two economies have developed with a completely different speed. To put it in numbers: The U.S. experienced an average growth rate of 2.4% in 2008-2013 while nominal GDP in the euro area on average expanded by 1.1% only. Taking only 2010-2013 into consideration, the difference in the average growth rate is even more astonishing (or shocking from a European perspective): Average U.S. growth was 3.8% compared to 1.9% in the euro area. The U.S. recovery, although having not yet yielded the wished for employment effects, seems to be decoupled from the troubles and hence years of weak growth the euro area has been facing so far.
The large nominal GDP growth differential between the two economies compares to an almost synchronous increase in consumer prices (CPI): Average consumer price inflation in the euro area and in the U.S. was almost precisely 2% in 2008-2013.
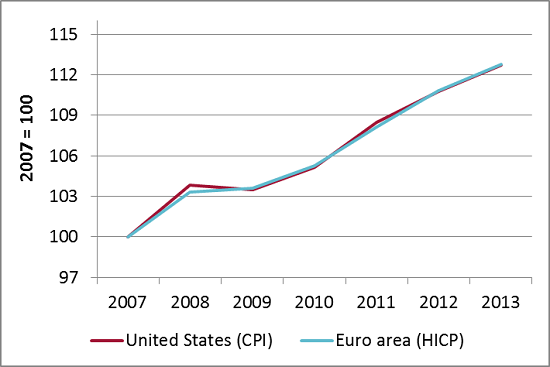
Figure 2: Consumer price indices.
Source: AMECO database.
What does this mean for the real GDP differential?
Very little, in fact. The equal increase in CPI does not imply that the growth differential in real GDP is of the same magnitude as in nominal GDP. Real GDP is calculated based on the GDP deflator as a price index, which reflects price changes of produced rather than consumed goods and services.
The GDP deflator and the CPI thus do not necessarily measure the same price changes. U.S. producer prices (measured with the GDP deflator) increased on average by 1.6% in 2008-2013 while they increased by only 1.3% in the euro area. Of the 9% difference in nominal GDP performance in 2008-2013, 3 percentage points can thus be explained by the difference in price deflators, which are unrelated to consumer price developments. A real GDP growth differential of still impressive 6 percentage points makes up for the remaining difference in 2008-2013. More work on explaining the difference between CPI and the GDP deflator seems warranted.
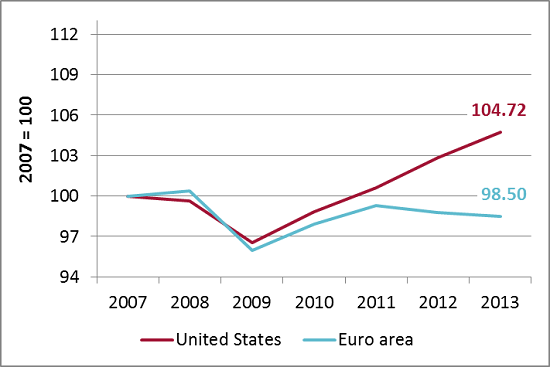
Figure 3: Real GDP.
Source: AMECO database.
Related content

The macroeconomics of decarbonisation
At this event we will launch the book "The Macroeconomics of Decarbonisation: Implications and Policies"

What visions for Europe? Unpacking EU parties’ economic strategies
The EU elections are around the corner. What economic plans are the parties advocating for?

Halftime for the European Union’s recovery fund: is the glass half full or half empty?
How has the RRF performed at its halfway point in terms of implementation, results orientation and additionality for future EU funding instruments?

Visions for Europe: Economic expert debate for the 2024 EU elections
Bruegel and the Financial Times partnered up to host a debate featuring representatives from EU political parties on EU economic issues