Blogs review: China's GDP (PPP) to surpass the United States?
What’s at stake: Many news outlets picked up the release of new “purchasing power parity” estimates by the International Comparison Program, emph
What’s at stake: Many news outlets picked up the release of new “purchasing power parity” estimates by the International Comparison Program, emphasizing that China’s economy is likely to surpass the U.S. in size sometimes this year according to this measure. While noticeable, this was not the most interesting aspect of these revised estimates.
The World Bank releases its new estimates of PPP
Kaushik Basu writes that a fascinating feature of purchasing power parity (PPP) is more people hold an opinion on it than know what it means. This was in ample display when the Global Office of the International Comparison Program (ICP), hosted by the World Bank, announced the latest PPP data for the world, pertaining to 2011.
Timothy Taylor writes that to overcome the problems with using market-based exchange rates, a common approach since the 1970s has been to use PPP exchange rates. A PPP exchange rate is based on an effort to figure out the "purchasing power" of a currency in terms of what that currency can buy. Calculating the PPP exchange rate is now done once every six years, because it is an enormous project, involving the collection of a wide range of price data in 199 different countries, trying to adjust for differences in quality, and then compiling it all into comparable price indexes.
Michael Pettis writes that the PPP model has two important assumptions. The first assumption, an explicit one, is that different countries assign different prices to the goods and services consumed domestically in a way that is not fully captured in the exchange rate. The PPP adjustment is an attempt to correct for this by taking the US economy as the standard, comparing prices of a specified basket of goods and services in the US with a second country. But the second assumption, implicit but just as important, is that the US GDP numbers very broadly capture economic activity in the US in the same way that other countries’ GDP numbers capture economic activity in these economies.
Differences with the 2005 version
Matthew Yglesias writes that the latest methodological shift in PPP calculations, including an effort to weigh the importance of different kinds of goods and to use a richer set of countries to compare prices interregionally give a bigger PPP boost to many middle income countries.
The ICP writes that with the release of the ICP 2011 results, it is inevitable that the positions of economies in 2011 will be compared with those in 2005 by simultaneously studying changes over time and across economies. However, many of the comparisons will be problematical because they will be based on two different price levels, and so real expenditures and PLIs will not be directly comparable between 2005 and 2011. In addition, some of the economies participating in one of these comparisons did not participate in the other comparison; a small number of economies moved from one region to another; and, most important, some significant changes in methodology were implemented in ICP 2011.
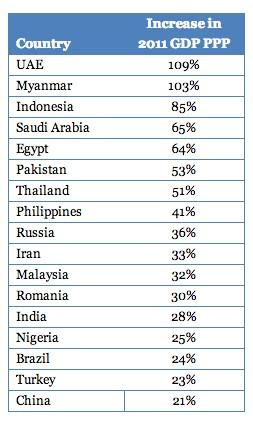
Source: Antonio Fatas
Antonio Fatas writes that the most recent PPPs have introduced a completely different lens to compare price levels and living standards across countries. The table below shows how different the size of economies is as calculated using 2011 PPP compared to what we thought before these estimates were released.
China’s weight in the world economy
Real Time Economics writes that according to the PPP measure, China will top the U.S. as the world’s largest economy this year.
Jeffrey Frankel writes that the reports trumpeting that China is to overtake the US as top economic power are misleading because comparing countries’ GDPs using PPP rates, rather than actual exchange rates, is the right thing to do if you want to measure people’s living standards. But it is the wrong thing to do if you are looking at national income in order to measure the country’s weight in the global economy. When we talk about size or power it’s how much the Yuan can buy on world markets that is of interest, not how many haircuts or other local goods it can buy back home. Where the issue is total economic heft, you want to use GDP evaluated at current exchange rates.
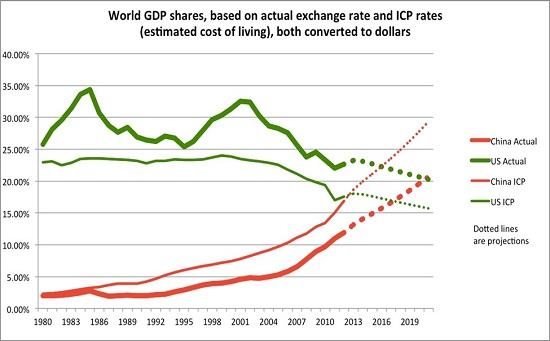
Source: Jeffrey Frankel
Jeffrey Frankel writes that at current exchange rates, the American economy is still almost double China’s, 83% bigger to be precise. But the crossover day is not far off, as the graph shows. If the Chinese real growth rate continues to exceed US growth by 5% per annum and the Yuan appreciates at 3% a year in real terms (inflation is higher there), then China will pass the US by 2021. Soon, but not imminent.
PPP estimates and the Renminbi
Gavyn Davies writes that the new prices data suggest that the renminbi is now approximately fairly valued.
Martin Kessler and Arvind Subramanian writes that this is a striking change from 2005, when the currency was undervalued by nearly 30 percent. The basic idea underlying the PPP-approach is that there is a positive relationship between prices and income per capita known as the Balassa-Samuelson effect: Poorer countries usually have lower prices in the nontradable goods and services sector and hence a lower general price level, which allows resources to flow to tradable sectors: A low price level thus reflects a depreciated exchange rate. For a given level of income, we can infer what the level of prices and hence the equilibrium exchange rate should be. Prices below this level indicate undervaluation, and above this level, overvaluation.
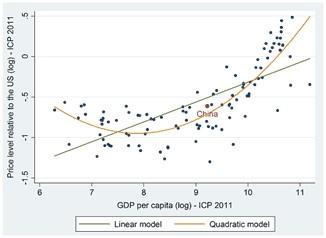
Source: RealTime Economic Issues Watch
Martin Kessler and Arvind Subramanian writes that not only are broad macroeconomic aggregates (for example, the current account deficit) moving in the right direction, but underlying relative price movements (and signals) seem to have shifted in a way to stop the flow of resources into export sectors, which now allows China to proceed with its rebalancing strategy.