Real exchange rates after the Swiss tsunami
The surprise abolition of the 1.2 Swiss franc/euro exchange rate floor by the Swiss National Bank sent shock waves to currency markets. The instant re
The surprise abolition of the 1.2 Swiss franc/euro exchange rate floor by the Swiss National Bank sent shock waves across currency markets. The instant reaction was an appreciation of the Swiss franc by more than 30 percent, which corrected somewhat later, along with changes in other currency rates. Today the franc is traded at a rate of about 1 to the euro, implying 20 percent nominal appreciation.
How have real effective exchange rates (REER) changed after such fierce currency movements? We updated our REER dataset and approximated January 2015 values for the REERs by using the nominal exchange rates of 17 January 2015 and assumed that the 12-month rate of consumer price inflation remained unchanged in January 2015.
The figures below show the REERs of six major currencies relative to their historical average over January 1970 – January 2015. While the equilibrium rate of a currency is determined by various economic factors and is not equal to its historical average, the figures below might be indicative of the currencies’ relative strength.
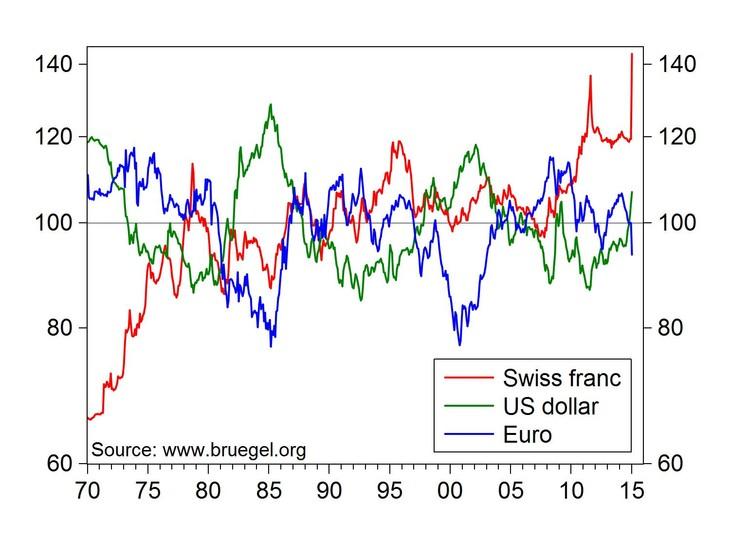
The Swiss franc is at record high in real effective terms: more than 40 percent above its historical average
The Swiss franc is at a record high in real effective terms: more than 40 percent above its historical average. This may help to reduce the huge current account surplus of Switzerland, but may push the country to deflation.
The US dollar has continued its recent trend of real appreciation (it is now 7 percent above its historical average), while the euro’s slide continued (6 percent below its average). There have been a couple of times in the past 45 years when the dollar was much stronger and the euro was much weaker than today, so recent trends may continue if the differences in economic strength and monetary policy persist.
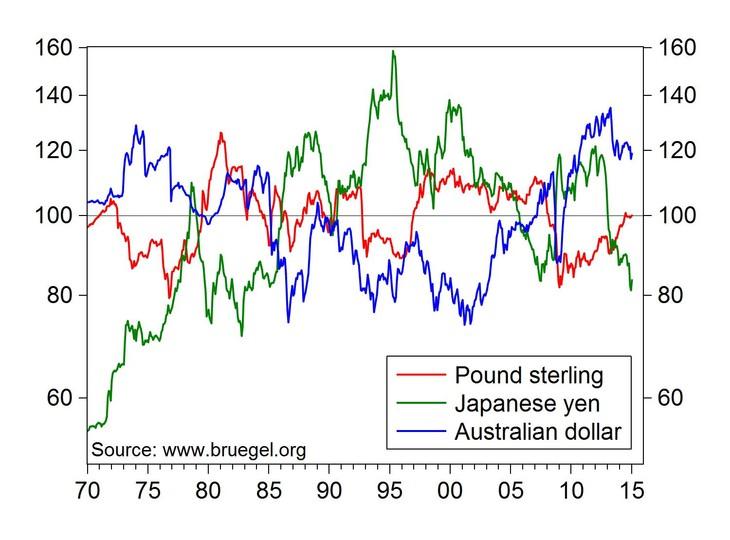
Interestingly, the Pound sterling is exactly at its historical average, so its recent strengthening has just compensated for its previous weaknesses. The Aussie gave back some of its strength, yet it is still about 20 percent over its historical average, while the yen is about 15 percent below it.
See our dataset including monthly REERs for 154 countries and annual REERs for 179 countries here.
Consumer price index-based real effective exchange rates (average 1970-2015 = 100), January 1970 – January 2015
Source: Bruegel. Note: the real effective exchange rate is calculated against 41 trading partners
About the authors
Related content

The impact on the European Union of Ukraine’s potential future accession
This report evaluates the impact on the EU of a possible EU accession of Ukraine, focusing on economic consequences and institutional developments.

The EU needs a methodology for including reform impacts in fiscal trajectories
Such a methodology, and a governance mechanism for managing associated risks, must be in place before the new fiscal framework kickstarts in September

Real effective exchange rates for 178 countries: a new database

Emerging countries have replaced most of Russia’s lost trade with advanced economies
Russian trade overall seems to have suffered little from sanctions; meanwhile, medicine and food trade continues with sanctioning countries