The triumph of backward-looking economics
What’s at stake: At a time when monetary policy makers have a hard time generating inflation despite credible monetary regime changes (e.g. Japan), it
Olivier Blanchard and David Johnson write that (HT Mark Thoma) from 9% in 1979, the three-month Treasury bill rate was increased to 15% in August 1981.
No credibility miracle and the presence of inflation inertia
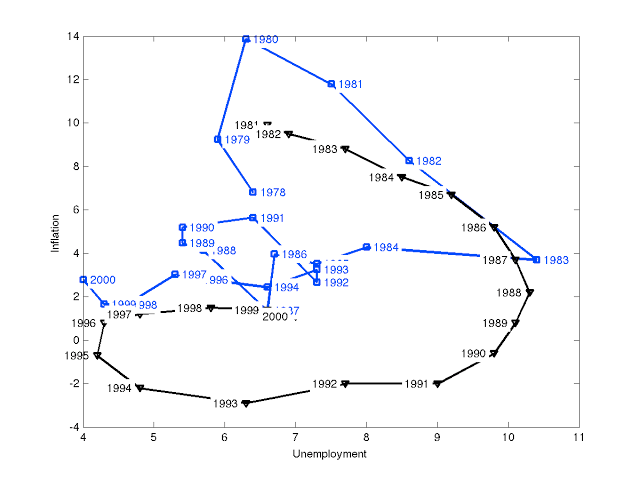
Paul Krugman writes that there is a curious belief about history namely that the experience of disinflation in the 1980s was a huge shock to Keynesians, refuting everything they believed. What makes this belief curious is that it’s the exact opposite of the truth. Keynesians came into the Volcker disinflation with a standard, indeed textbook, model of what should happen. And events matched their expectations almost precisely. Unemployment shot up faster than in Tobin’s simulation (see graph below), then came down faster. But the basic shape — a clockwise spiral, with inflation coming down thanks to a period of very high unemployment — was very much in line with what standard Keynesian macro said would happen.
Paul Krugman writes that there was, on the other hand, no sign whatsoever of the kind of painless disinflation rational-expectations models suggested would happen if the Fed credibly announced its disinflation plans. Olivier Blanchard and David Johnson write that there was indeed no credibility miracle: Disinflation was associated with a sharp recession, with negative growth in both 1980 and 1982, and with a large and long-lasting increase in unemployment.
Source: The Grumpy Economist.
Note: The black line shows a simulation based on a backward looking model. The blue line shows actual historical data.
1984 and the absence of a high sacrifice ratio
John Cochrane writes that adaptive-expectations ISLM models were predicting years and years of unemployment to quash inflation, and it didn't happen. The Keynesian IS-LM model failed to predict how quickly inflation would take off in the 1970, as the expectations-adjusted Phillips curve shifted up. It then failed to predict just how quickly inflation would be beaten in the 1980s. It predicted agonizing decades of unemployment. Instead, expectations adjusted down again, the inflation battle ended quickly.
Stephen Williamson writes that Tobin's view was that there was substantial inertia in inflation, and that it was very costly to bring it down. In Tobin’s simulation, after 7 years of monetary disinflation, the unemployment rate peaks at more than 10%, and it takes more than 12 years to get back to what Tobin thinks is the natural rate of unemployment, 6%. Tobin is using a model with adaptive expectations and a Phillips curve with what people then would have called a "high sacrifice ratio." You have to suffer a lot of unemployment to get a small reduction in inflation. Of course, Tobin's simulation looks nothing like what happened.
John Cochrane writes that the two curves were parallel in 81 to 83, with reality moving much faster. But in 1984 it all falls apart. You can see the "Phillips curve shift" in the classic rational expectations story; the booming recovery that followed the 82 recession. And you can see the crucial Keynesian prediction error: After the monetary tightening is over in 1986, no, we do not need years and years of grinding 10% unemployment. Stephen Williamson writes that if we look only at the 1981-82 recession, which is defined by a peak in 1981Q3 and a trough in 1982Q4, the drop in the quarterly PCE deflator was about 3.6%, or an average of 2.9% per year. By Okun's estimate, this should have resulted in a 29% drop in GDP per year. What actually occurred was a drop in real GDP during the recession of about 2.5%, or an average of about 2% per year.
LM writes that reality worked out a middle way between the Tobin model and the rational expectations model. The basic RBC model for instance would predict no effect whatsoever on employment following purely monetary policy shocks. Of course, adding a fiscal policy response would provide a different result. Stephen Williamson writes that the RBC is a non-starter here, as that's not a model of monetary policy. We want something that captures a non-neutrality of money, so that we can see if this somehow matches the data. Of course, NK models have that. A well-defined exercise would be to see how much price stickiness you need to replicate the data for the Volcker period.
About the authors
Related content
The fiscal stance puzzle
What’s at stake: In a low r-star environment, fiscal policy should be accommodative at the global level. Instead, even in countries with current accou
The state of macro redux
What’s at stake: In 2008, Olivier Blanchard argued in a paper called “the state of macro” that a largely shared vision of fluctuations and of methodol
Racial prejudice in police use of force
What’s at stake: This week was dominated by a new study by Roland Fryer exploring racial differences in police use of force. His counterintuitive resu

A tale of two treatises: the Werner and Delors Reports and the birth of the euro
Focusing on the Werner and Delors Reports, this essay aims to capture key ideas and debates, giving a chronological overview of the EMU process