Low carbon technology exports: the race is still open
A country’s relative strength in exporting a certain product is likely to persist. But it is easier to gain a comparative advantage in exporting low c

The project leading to this blog post [COP21 RIPPLES] has received funding from the European Union’s Horizon 2020 research and innovation programme under grant agreement No 730427.

It is self-evident that countries tend to be better at producing and exporting some goods than others. The factors that drive a country’s competitive advantages have been a subject of discussion for decades. The idea of “comparative advantage” as originally developed by Ricardo was considered static and dependent only on resource endowments. However, in the wake of globalisation and the liberalisation of international markets, new trade theories incorporated dynamic and endogenous properties. In these models, countries could alter their trade specialisation through technological change and knowledge accumulation. Trade policy in most western countries consequently adapted to this new globalised world by encouraging R&D investment, with the assumption that a technological advantage promotes a trade advantage.
If policymakers want to “engineer” comparative advantages, they need to understand how volatile or path-dependent a country’s specialisation actually is. How easy is it to shift a country’s export behaviour, and are low-carbon sectors more or less flexible? It is especially interesting to ask how easy it will be for countries to develop a comparative advantage in exports that are relevant to the transition to a low-carbon economy, since these are likely to be high-growth sectors.
In this piece, we focus on comparative advantage in four emerging sectors that are strategic for the low-carbon transition: solar panels (photovoltaics - PV), wind turbines, batteries and electric vehicles. First we examine trade specialisation, based on export data. Then we analyse the path-dependency in technological specialisation, based on patent data. Finally, we explore the correlation between the trade and technological domains.
We use a relative measure of trade specialisation - the Revealed Comparative Advantage (RCA) - and a relative measure of technological specialisation - the Revealed Technological Advantage (RTA). This is important in order to take account of size differences at the sector and country level (see the methodological annex below). All years and countries for which sufficient data is available were considered.
How persistent is a country’s export specialisation?
Our first domain is trade. How changeable is a country’s specialisation in exporting certain goods? More specifically, is specialisation in a low-carbon product more or less changeable than the general trend for all products?
On the first question we see that the revealed comparative advantage (RCA) in a certain export good is typically quite highly correlated with the RCA in this product in previous years. Figure 1 shows the historical correlations of RCA in the year 2015 in a range of products. For half of the products (the median) the correlation between the 2015 RCA and the RCA in the same product 10 years ago is 0.7 or more. This persistency implies that countries rarely make large jumps in terms of the products which they are particularly good/bad at exporting.
Interestingly, it seems that current strength in exporting our four low-carbon products is on the whole less correlated to past strength. This is particularly visible for electric vehicles (EV), which are among the products with the lowest persistency (they sit in the lower part of the grey area). But a country’s current strength in exporting batteries, wind and PV also tends to exhibit less correlation with past strength than most other products. This is in line with the common narrative that low-carbon technologies are less mature/more dynamic than the average export sector. That means they should be good sectors for policymakers to focus on when attempting to foster comparative advantage.
Figure 1 – Correlation of the 2015 RCA with the same sector’s past RCA
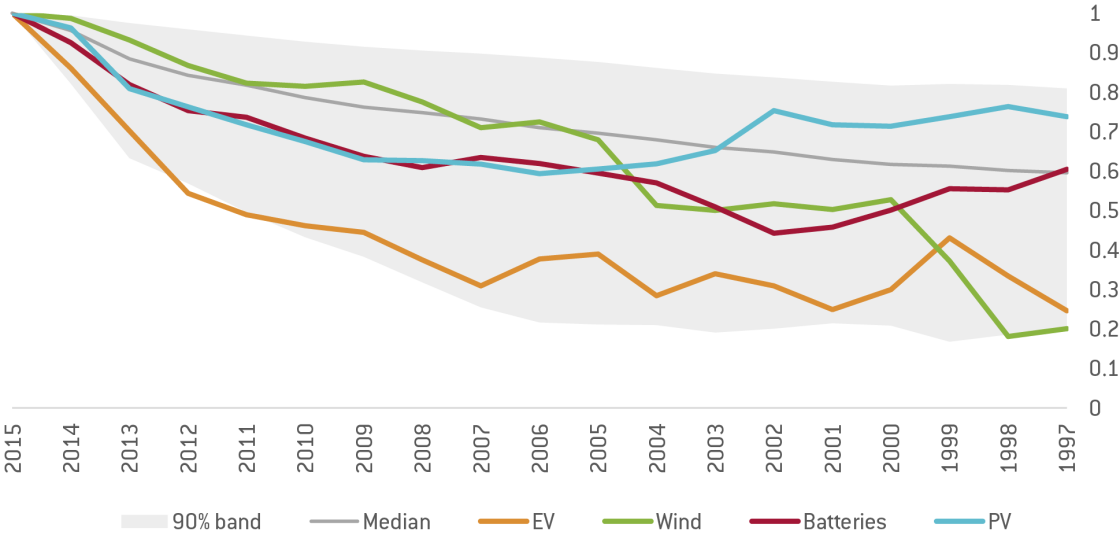
Source: UN COMTRADE database, own calculations.
Notes: The chart shows the correlation of each sector’s RCA in 2015 with the same sector’s RCA in each previous year, across countries. All countries for which data are available were considered and the exact number of countries for each correlation depends on each year-sector export data availability. The dotted line is the median correlation, across all 5482 export products, of the RCA in 2015 with the corresponding RCA in each previous year. The shaded area comprises the RCA correlations of all sectors between the 5th and the 95th percentiles of the distribution.
We also observe some differences across technologies:
Wind turbines’ current revealed comparative advantage is most correlated to past comparative advantage in the short and medium term - above 0.8 for the first 5 years and at least 0.6 after 2005 - and the lowest in the long term, dropping below 0.4 before 2000. This implies that the market, after a very dynamic phase in the late 1990s, seem to have matured around 2005.
Solar PV export specialisation is notable for its long-term path-dependency. Countries that were strong at exporting solar panels before 2002 are very likely to be strong today. However, in the intervening years, some countries seem to have gained/lost comparative advantage. The gives lower RCA correlations in the 2002-2012 period. This is consistent with a narrative where countries that were specialised in PV early suffered from the emergence of new players (such as Germany). But the situation then reverted in favour of the early-specialised countries. The reason might be that policy-driven expansion of the solar industry in several countries did not manage to generate a lasting comparative advantage.
Electric vehicles present a different picture again. The low persistency points to the fact that this is still a small and novel market, with several players (of which some, like Tesla, are completely new) trying to establish a lasting comparative advantage. Once mature, the EV market will possibly stabilise like the wind or PV market. But at the moment this is difficult to say, since even in recent years the EV sector has proven to be highly dynamic.
Finally, the market for batteries is always relatively close to the level of path-dependency exhibited by the average export product – albeit typically slightly lower. So gaining/losing a comparative advantage in battery exports is a bit more likely than for traditional products, but the battery market is nowhere near as dynamic as the market for electric vehicles. China’s clear leadership and the difficulty for western countries to gain relative specialisation in the battery market contribute to the high RCA persistency.
Our results illustrate that the comparative advantage of a country’s exports is very path-dependent. Hence, developing new comparative advantages is likely to be difficult for a country. However, we also show that the chances to do so are somewhat higher for immature sectors – such as certain low-carbon technologies.
Patenting implies that technological specialisation is more changeable
Patents are a very imperfect measure of R&D activity, which is a complex multi-stage process with many interactions. Nevertheless, patent counts are one of the few indicators that allow us to identify on a regular basis the patentable technologies on which a country focuses its R&D activities – and compare this with other countries and technologies. This is how we can generate relative measures of technological specialisation.
Looking at the correlation between current and past patenting activity (Figure 2), we see that technological specialisation is much less path-dependent then trade specialisation. For half of technological fields a current technological advantage has less than 50% correlation with a technological advantage in the same field only two years ago. In comparison, more than 95% of the export-based RCAs had more than 50% correlation with the corresponding two years before. Hence, it appears much more likely that a country can develop a technological advantage without a prior specialisation in the exact same technological field.
Figure 2 – Correlation of the 2014 RTA for low-carbon technologies, with the same technologies’ past RTA
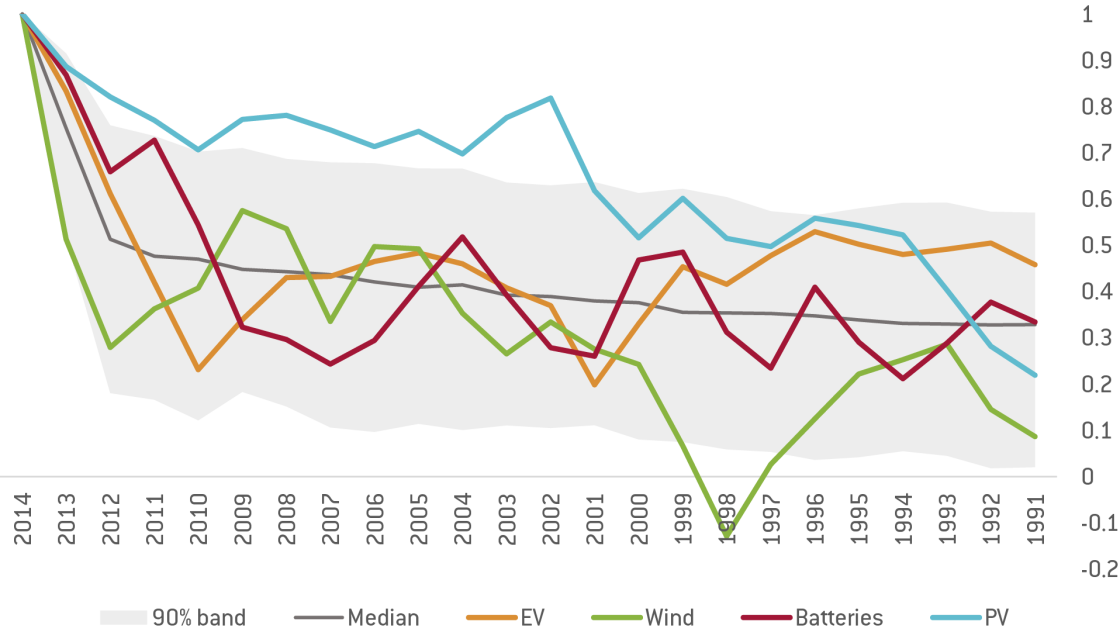
Source: PATSTAT database (2016 Autumn Edition), own calculations.
Notes: The chart shows the Pearson’s r correlation coefficient of each technology’s RTA in 2014 with the same technology’s RTA in each previous year, across countries. Formally, it computes r(RTA[2014], RTA[2014-t]) for t=0...n where t=0 is the correlation of the 2014 vector of RTA with itself (r=1), t=1 computes r(RTA[2014], RTA[2013]) and so on until 1991 (maximum length of the series). Only countries with a total number of patents of at least 500 during across the full period (1990-2014) have been considered. The dotted line is the median correlation, across all 640 technologies, of the RTA in 2014 with each previous year. The shaded area comprises the RTA correlations of all sectors between the 5th and the 95th percentiles of the distribution obtained after sorting them from smallest to largest in each year.
In this case our four low-carbon technologies are no exception. Their autocorrelations largely track the median, sometimes above, sometimes below, and spanning across the 90% band, even leaving it in some case. However, once again there are differences between the technologies:
Solar PV is the most path-dependent technology of the four. It stays for 13 years at levels above the 95th percentile of the RTA correlation distribution, making specialisation in PV one the most persistent technological specialisations of all. This either implies that countries which are good in PV patents continuously invest relatively more than others, or that there are indeed some structural path-dependencies in the emergence of a strong PV research sector.
Wind, electric vehicles and batteries mostly follow a zig-zag pattern around the median, with wind technology strength in 2014 even being negatively correlated with strength in wind technology in 1998.
This implies that a country’s comparative advantage (in exports) in the sectors that are shaping the low-carbon revolution is much more path-dependent – and thus predictable – than the technological advantage (in patenting) for the corresponding sectors. Thus countries might be able to shape their technological specialisation, by investing in knowledge creation and acquisition, more easily than they can change their production structure and export specialisation.
Explore country level data on export and technological specialisation
The authors thank Robert Kalcik for the interactive map above
Correlation of past patenting and current export specialisation
Less clearly defined is the channel linking the trade and technological dimensions. One would expect that countries which developed new technologies in the past would find it easier to be competitive in the global market in these technologies today. Properly analysing this question is difficult, because causality is unclear (countries that are strong in a sector also tend to patent more). Moreover, patent classes and export categories can only be mapped very roughly, so the complex interaction within and between research/production sectors might be missed.
Nevertheless, our data in figure 3 tell two interesting stories. First, countries that are good at exporting PV today are indeed often the countries that previously had the highest patenting specialisation in PV technology. This is shown by the high correlation between RCA and past RTA. This is much less the case for the three other technologies, which might point to a lower importance of patents in these goods, or a worse match of technology and export categories.
The second interesting finding points to a lag in the impact of research specialisation on sectorial export strength. We see this most clearly with electric vehicles, where the patenting strength in 2005 has a higher correlation (50%) with current export strength than the patenting strength in all subsequent years. This pattern is consistent with the idea that there is a delay between R&D and actual mass production. Similarly, although much less pronounced, the highest correlation between patenting strength and today’s exports for wind is also in the past (2009). Batteries, on the other hand, seem to enjoy a faster conversion of technological specialisation into export strength, with the peak after just two years (2013). However, we have to caution the reader that our correlation analysis does not establish significance, let alone causality.
Conclusion
In conclusion, countries’ comparative advantages are not as static as suggested by Ricardo. But they do show a high degree of persistence, despite shifting policies and market conditions. Conversely, countries’ technological advantages are less path-dependent and thus possibly more inclined to be affected by policy instruments. We even find some (still weak) indication that past patenting strength has a positive impact on exports. We plan to explore this relation more rigorously to study to what degree and under which conditions technological advantage can turn into comparative advantage.
Methodological Annex
The Relative Comparative Advantage (RCA), or Balassa Index (Balassa, 1965), is the most widely used measure of competitive advantage used in international economics to assess a country’s export potential in a specific product-sector. The RCA for sector j in country a is computed as the share of exports X of j in a’s total exports divided by the share of world’s exports of j in total world exports. An RCA equal to one means that the export share in sector j of country a is equal to the world’s export share in total exports; an RCA above 1 indicates a relative comparative advantage, or specialization, in sector j compared to the world average.
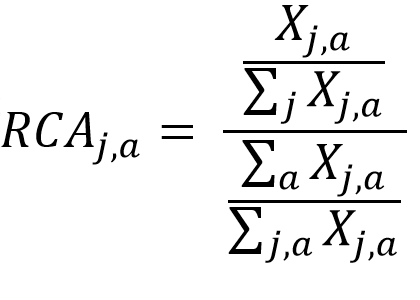
This index is comparable across countries, sectors and time, being a relative measure with respect to both the size of the country and the size of the sector. Data come from the UN COMTRADE database, according to the 1996 classification of HS codes for 6-digit product classes. In order to avoid issues related to data quality (especially missing values), years are pooled together in couples: for instance, the RCA for 2015 is calculated on the basis of exports in 2014-2015. All countries and years for which data is available have been considered.
A standardisation is applied to the RCA to improve its statistical properties (namely normality) and to be bounded between 0 and 1, with ½ being the non-specialisation case (when the country’s share in the sector equals its share in all fields) and values above ½ imply a relative specialisation of that country in that sector. The standardised RCA is obtained as
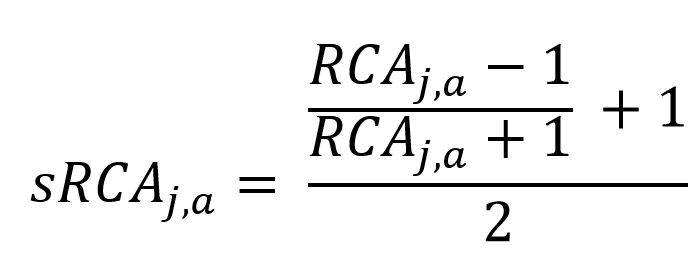
To obtain the Relative Technological Advantage (RTA) and its standardised version (sRTA) an equivalent procedure is applied to patent data, retrieved from the PATSTAT database (2016 Autumn Edition). For the sake of international comparability, only data from European Patent Office (EPO) and Patent Cooperation Treaty (PCT) applications are considered, while those from national patent offices are excluded to avoid country biases. As suggested by the OECD, only countries with a total number of patents of at least 500 across the full period (1990-2014) have been considered. The country(ies) to which a patent is assigned is that of the inventor(s)’s address(es) of residence, implementing fractional counting to take into account multiple inventors.
The sectors (technologies) considered have been chosen to reflect the trends of the four main drivers of the current shift towards a low-carbon economy. Specifically, the HS codes (for exports) and the IPC codes (for technology) used are the following:
To obtain the autocorrelations of the sRCA (sRTA) in each sector (technology) the last year groups available of each series is correlated to all the previous ones across countries. Similarly, the correlations are obtained by computing the Pearson’s correlation coefficient between the 2014-2015 sRCA and all past sRTA across countries in each HS-IPC category.
We also checked the classic autocorrelation functions for each product/technology and found roughly the same results. We, however, choose to only report the correlation with the 2015 RCA/RTA as a means to also spot recent developments (autocorrelation functions implicitly assume autocorrelation to be constant over time).
We also checked for trends in RCA and RTA. Those were typically relatively persistent for our four technologies. The exemption was the RTA for wind that grow over the sample while the RCA slightly fell over the sample period. These developments can have different reasons, but would not on their own explain the pattern of persistency we found in Figure 1 and Figure 2.
About the authors
Related content

The macroeconomics of decarbonisation
At this event we will launch the book "The Macroeconomics of Decarbonisation: Implications and Policies"

European natural gas imports
This dataset aggregates daily data on European natural gas import flows and storage levels.

The Letta report: an assessment of the energy proposals
The report has the potential to substantially impact the European Union's strategic agenda from 2024-29

The impact on the European Union of Ukraine’s potential future accession
This report evaluates the impact on the EU of a possible EU accession of Ukraine, focusing on economic consequences and institutional developments.