The shadow of Brexit: Guessing the economic damage to the UK
Under a set of assumptions, this post concludes that UK real income and investment would have been 4% and 6% larger respectively had it not been for t

Brexit is delivering every day a new coup de theatre, new uncertainties and new challenges. The action is mostly on the Dover side of the Channel, but the consequences are also felt on the Calais side.
Attention is, rightly, concentrated on the political issues, as they will determine what will eventually be the end result of the tortuous process. There are, however, also some interesting economic issues in the background.
In a post published on May 23rd last year, I advanced the hypothesis that the macroeconomic consequences of the unexpected result of the UK referendum to leave the European Union were starting to be visible, in terms of lower growth and persistently higher inflation relative to the euro area. Although I concluded that I could not demonstrate that the referendum’s outcome was the cause of the worsening macroeconomic conditions, still I argued that the circumstantial evidence led to that conclusion.[1]
In this post I want to look again at the issue, availing myself of newly available information.
While this post has something to say about Brexit, one can also take it as relevant for an assessment of the importance of expectations for economic developments. Indeed, the ‘leave’ vote in the Brexit referendum has only changed expectations and not, directly, any hard economic variable. If we detect possible consequences, these must be due to the fact that expectations have changed.
And, of course, we have to recognise that it is not easy to be precise about the change of expectations, since these reflect the weighted average, with unknown weights, of three possible outcomes, each with uncertain consequences: Brexit without a deal, Brexit with a deal, and no Brexit.
So we are possibly seeing the effects of a composite change of expectations: if expectations were more precise, the consequences would be themselves clearer. The issue of the composite nature of Brexit expectations is taken up again at the end of this post.
It seems clear, however, that expectations have indeed changed. The best place to look for evidence is in the foreign exchange market: unlike macroeconomic variables, the exchange rate can jump when expectations change and, in fact, it did jump on the occasion of the referendum.
This can be seen in Chart 1: just on the date of the referendum, sterling depreciated by nearly 7% against a basket of currencies, an extraordinarily large movement in one day, clear evidence of a shock. Subsequently the exchange rate settled at a new lower level, moving up and down within a relatively narrow corridor, mostly reflecting the flow of news about Brexit.
Chart 1. Nominal effective exchange rate. 04/01/2011 – 08/03/2019
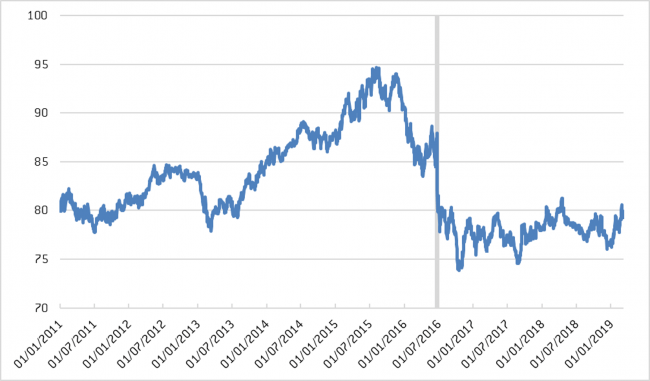
Source: Bank of England Database, Effective exchange rate index, Sterling (Jan 2005 = 100). The vertical line is for the date of the Brexit referendum.
In my previous May 2018 post, I noted the inversion in relative growth between the UK and the euro area, whereby the UK – unlike in previous years – started growing at a slower rate than the euro area shortly after the referendum.
The update of the figures, in Chart 1, shows that in the latest two quarters the euro area and the UK have grown practically at the same rate; so the UK is not losing further ground with respect to the euro area, but neither is it regaining its higher, pre-referendum rate of growth.
The interpretation I offer of this development is that the expectation shock delivered by the Brexit referendum result had a lagged and protracted effect on real growth, consistent with the fact that real variables are characterised by a lot of inertia. According to the evidence in Chart 2, one could conclude that the shock affected growth for a bit longer than two years.
Chart 2. Real growth in the UK and the euro-area. Q1 2011 – Q1 2019.
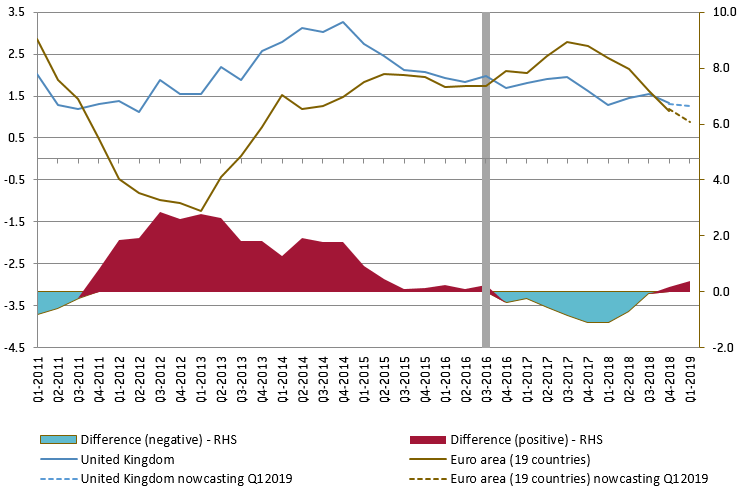
Note: The nowcasting for the United Kingdom and Euro area were provided by Mr P. Smith from IHSMarkit.
To give more sense to what the lower growth of the UK economy post-referendum means, I have carried out a back-of-the-envelope calculation of how much less, in cumulative terms, real GDP has grown, since the fourth quarter of 2016, with respect to the pre-referendum pace.
In the four years before the referendum, the UK economy was growing by some 1.2% more than the euro area on average every year. If this differential had remained constant, given that more than two years have passed since the referendum and given the growth in the euro area in this period, the UK economy would now be some 4% larger than its real current size.
Since we know that investment is the aggregate demand item that is more elastic to expectations, it is useful to zoom on this variable. This is done in Chart 3.
Chart 3. Investment in the UK and the euro area, levels and ratio. Q1 2010 – Q3 2018.
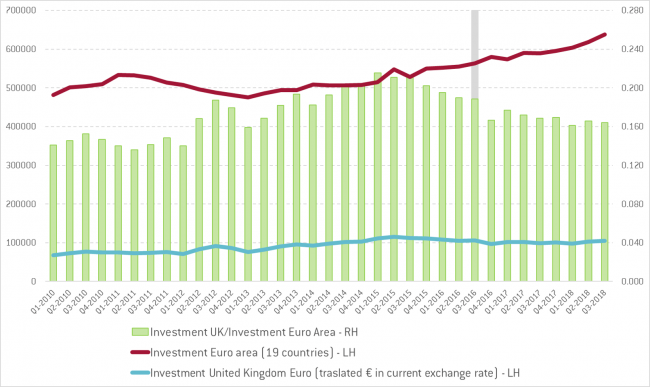
In this chart the levels of investment in the UK and in the euro area are reported, together with the ratio between the two variables. We clearly see here that investment in the UK, which was about 18% of the level in the euro area since around Q3-2012, has been well below this ratio since the referendum, at around 16%.
If the ratio between the investment in the UK and that in the euro area had remained at the same level as in the four years before the referendum, investment in the UK would have been some 6% higher than it actually has been. This does not prove, but is consistent with, a causal chain from the referendum result to expectations; from those, then, to investment; and finally to aggregate demand and, thus, real income.
In the post of May last year I also noted that, while growth had decreased with respect to the euro area, inflation had remained higher in the UK, thus breaking the consistency between higher growth and higher inflation in the UK with respect to the euro area. Chart 4 updates the information on inflation.
Chart 4. Consumer price inflation in the UK and the euro area (%), Q1 2011 – Q4 2018.
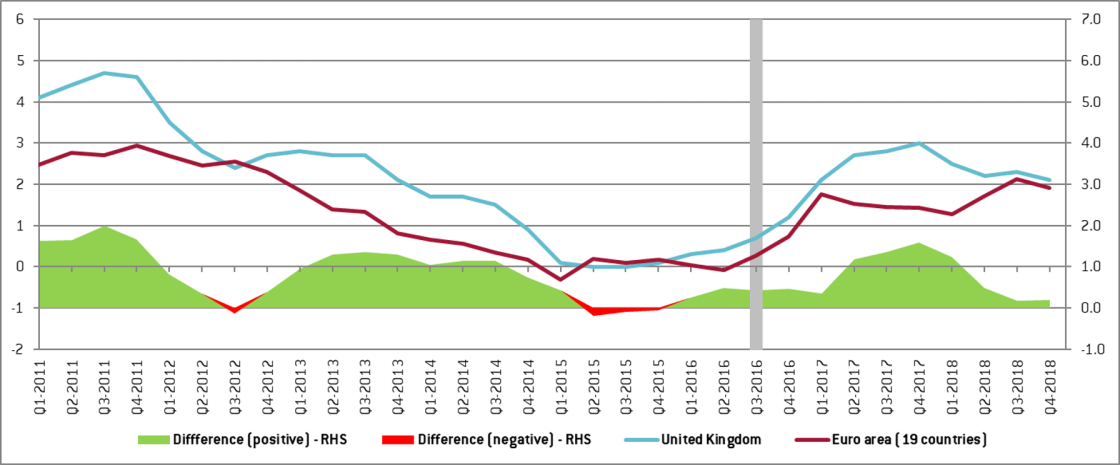
In the chart we see that inflation in the UK is, in the most recent period, practically the same as in the euro area. Thus, on both growth and inflation the UK and the euro area display the same performance after more than two years in which growth was lower and inflation higher in the UK with respect to the euro area. One could take this as evidence that the effect of the Brexit referendum on macrovariables is starting to peter out after having lasted for a little more than two years.
In conclusion, the behaviour of growth, investment and inflation in the UK relative to the euro area economy, which is by far its largest trading partner,[2] is consistent with an expectation shock delivered by the result of the Brexit referendum. This has likely caused cumulative lower growth by some 4% while investment would have been some 6% higher. Inflation in the UK came down and is now similar to that in the euro area.
These possible macro-economic effects, while significant, are not dramatic – but they are just, as the title of this post says, the shadow of Brexit working through expectations.
In addition, as mentioned at the beginning of this post, Brexit expectations are the weighted average of three very different events: Brexit with no deal, Brexit with a deal, and no Brexit. There is no objective measure either of the probabilities to be attached to the three events or of their economic consequences. Audacity is needed to build on such frail basis. Still, it may be illustrative to carry out some quantitative, yet arbitrary, exercise to extrapolate, from what has happened so far, the possible consequences of a revelation of one or other of the Brexit outcomes.
Let’s start from the estimated effects on growth and investment, via expectations, of the negative result of the Brexit referendum: four and six percentage points respectively for growth and investment. Let’s call these estimates generically Z. Let’s further call the probabilities of the three possible events, no-deal Brexit, deal-Brexit and no Brexit P1, P2 and P3, while x1, x2 and x3 are the damages expected from the three events. With these symbols, we can write:
x1P1 + x2P2 + x3P3 = Z
where it is assumed that, through expectations, the damage expected in the three events, weighted by the relative probabilities, have been anticipated, resulting in the effect Z, even before Brexit.
By inserting some heroic assumptions into the equation, we can derive what the effect would be if one or the other event finally materialised. In a way the exercise is to scale up, or down, Z depending on whether x1, x2 or x3 eventually prevails.
The first, most innocent but not totally innocent, assumption is that x3 = 0, i.e. there are no negative consequences if eventually there is no Brexit. Then one needs assumptions on P1 and P2 as well as the damage from Brexit without a deal, relative to the damage of Brexit with a deal, i.e. x1/x2 = k. With these assumptions, one can calculate x1 and x2, i.e. the consequences of Brexit without or with a deal.
For instance assuming that P1 = P2 = 0.33 and x1/x2 = k = 2, would mean that the negative consequences that we have seen so far are a half of the consequences that would derive from a no-deal Brexit (eight percentage points for growth and 12 for investment) and exactly the consequences of a Brexit with a deal.
This would also mean that if there is eventually a deal we should see no further damages, while in case there was no Brexit we should see an increase of GDP by some 4% and an increase of 6% in investment over a period of two years or slightly longer. Of course, different arbitrary probabilities as well as different assumed consequences of the different variants of Brexit would produce different results.
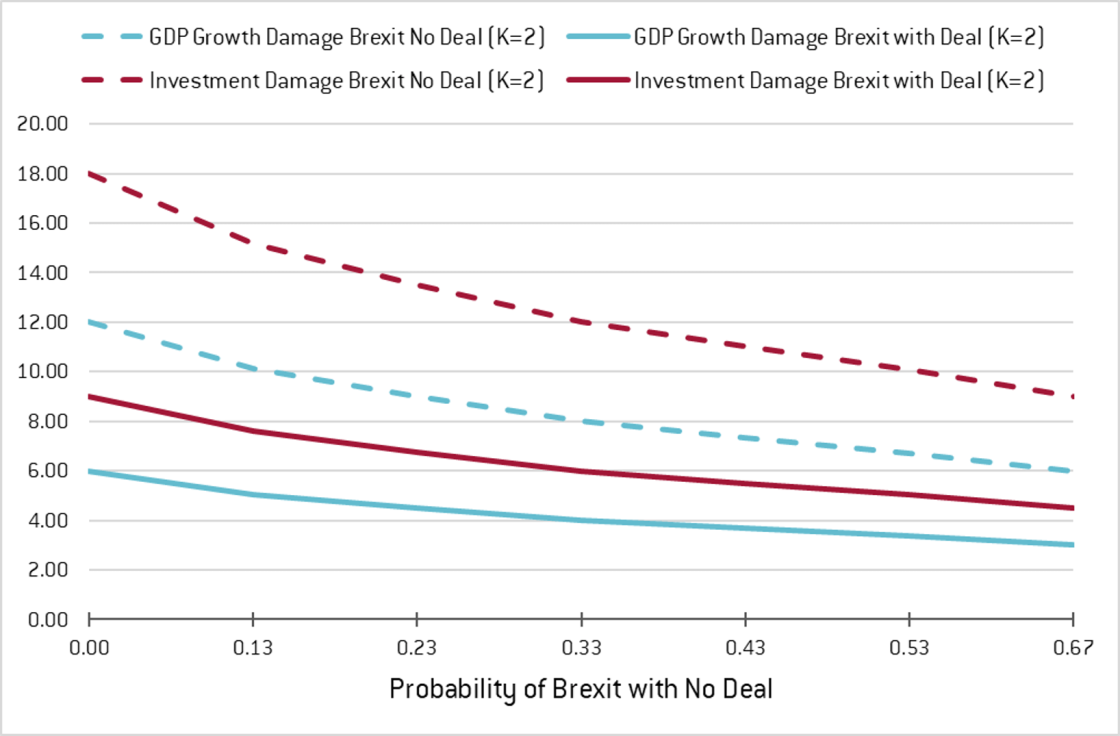
Chart 5 reports the damage resulting from no-deal Brexit and deal-Brexit along different probabilities of no deal (P1) as incorporated into expectations (in the horizontal axis), with the following assumptions:
- The probability of no Brexit is 0.33
- The damage from no-deal Brexit is the double of the damage from a deal-Brexit (k=2).
Chart 5. Damage resulting from no-deal Brexit and deal-Brexit.
Author calculations.
As it can be seen, the estimated damage, for both investment and growth, decreases as the probability of no-deal Brexit built into expectations increases. This is because the anticipated damage, Z, has taken place even if expectations were optimistic (little probability of no-deal Brexit is built into them). This must mean that the expected damage from Brexit is large. The opposite happens if expectations were pessimistic (high probability of no-deal Brexit is built into the expectations) and the damage actually produced is still Z.
Looking at the left side of the chart, expectations incorporate no or little fear that there would be no-deal Brexit, so damage Z must have been generated by the expectation of large negative effect from Brexit (high values of x1 and x2). For instance, if there was zero probability attached to no-deal Brexit, the damage from this event would be around 12% for growth and 18% for investment. Opposite considerations apply to the right side of the chart. If the probability attached to no-deal Brexit was high at 0.66, and this event eventually took place, it would cause a damage close to 6% for growth and 9% for investment, while a deal-Brexit would cause a total damage around 3% for growth and about 5% for investment, i.e. less than the already realised damage (i.e. Z).
Any reader as audacious as me, wanting to use her/his assumptions about the probabilities built into expectations as well as the relative damage of deal-Brexit vs. no-deal Brexit, could introduce them into the little spreadsheet enclosed with this post to see which results would be generated. Audacity should not be pushed, however to the point of taking the generated results as a true forecast of what could happen if any of the three Brexit variants would indeed materialise.
This post was prepared with the assistance of Leonardo Cadamuro.
References
[1] Causality is proved by B. Born, G. J. Müller, M. Schularick and P. Sedlácek in a paper taking a similar, if more sophisticated, approach, to estimate the macroeconomic damage from the result of the Brexit referendum: The Costs of Economic Nationalism: Evidence from the Brexit Experiment. Their estimate of the loss of real income due to the result of the referendum is lower, at about 2 per cent, than the estimate reached in this post.
[2] The euro area represents 53 % of UK imports and 44 % of its exports.
About the authors
Related content

The European Central Bank’s timid operational framework update
The European Central Bank announced limited changes to its operational framework – which is probably right given current uncertainty

The UK must learn that concessions cut both ways
Brexit may have come and gone, but the UK still wants to make decisions like it is part of the gang.

Don’t look only to Brussels to increase the supply of safe assets in the European Union
A sufficient supply of safe assets denominated in euros is critical if the European Union is to achieve a full banking and capital markets union.

European capital markets union: make it or break it
Capital markets union has not delivered, but it should be given a last chance, with a focus on supervisory integration