What will it cost the European Union to pay its economic recovery debt?
Servicing the EU debt until 2058 seems feasible, despite increased borrowing costs, but member countries must make choices about budget funding

As part of its NextGenerationEU (NGEU) post-COVID-19 recovery and economic greening plan, the European Union intends to borrow about €421 billion (in current prices) before the end of 2026 to fund “non-repayable support” to EU countries. This debt and the interest on it must be repaid before 2058 from the EU budget. Here, we estimate what these costs could amount to 1 This analysis is a shortened and updated version of a briefing written for the European Parliament Budgets Committee, which discusses additional questions about NGEU debt (Claeys et al, 2023b). .
The costs will depend mainly on the future trajectory of interest rates paid by the EU. Predicting interest rates for such a long time horizon is challenging but market expectations (based on interest rate swaps) provide a good baseline. For instance, market expectations are that 10-year rates will remain relatively stable until 2030, before slowly falling and stabilising at a lower level in the long run. Investors anticipate the 10-year euro swap rate, which closely mirrors EU yields (with a small spread, typically around 10 basis points on 10-year rates), declining towards 1.8 percent by 2058 (Figure 1, Panel A).
The uncertainty surrounding this expectation can be gauged by analysing the expected volatility of future interest rates. Probabilities that market participants attach to different future interest rate trajectories can be derived from swap-options. This exercise indicates considerable uncertainty about the future path of nominal euro rates. There is a 50 percent probability that rates will fall within the range of -0.4 percent to 3.4 percent in 2058, while the 90 percent confidence interval ranges from -4.1 percent to 6.2 percent (Figure 1, Panel A).
While the median trajectory for nominal rates represents a substantial increase compared to prevailing market expectations at the start of the borrowing programme in 2021, it is useful to also consider the change in real terms. Figure 1 Panel B compares 2021 and current market expectations for the 10-year real interest rate on EU debt. In 2021, these expectations were negative for the entire period of the programme, making EU borrowing profitable in real terms. But since 2021, these expectations have moved up, resulting in a real rate of 0.92 percent in 2028, when new net issuance will end, before returning to negative levels after 2043. Thus, the real cost of EU debt is no longer expected to be negative, but the low average real rates indicate much lower interest costs than nominal rates might suggest.
Figure 1: 10-year euro swap rates, real interest rates, and market expectations (in %)
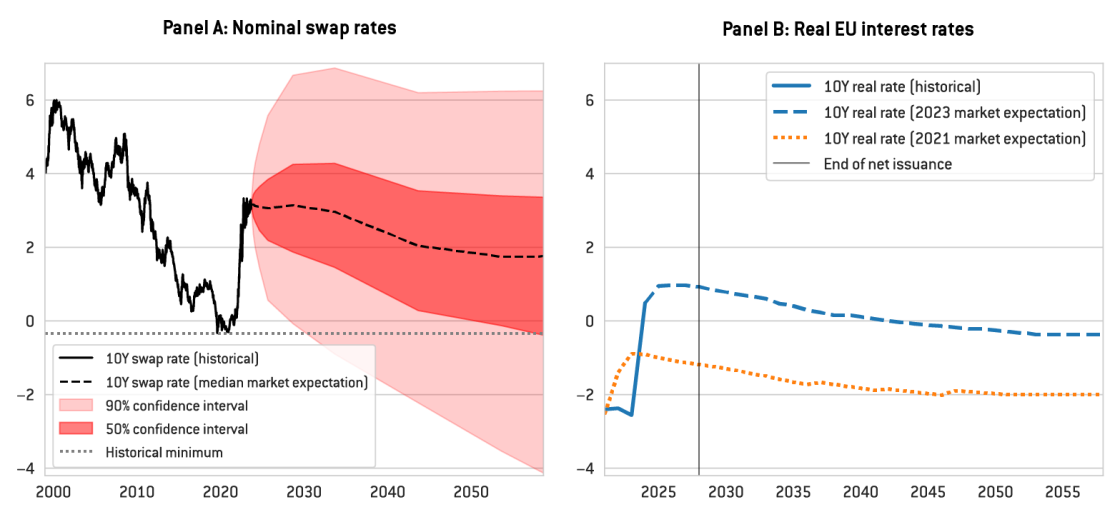
Source: Bruegel based on Danske Bank and Bloomberg. Notes: Panel A shows historical and possible future values of the 10-year euro swap rate, which reflects market expectations of the average short-term rate over the next 10 years and can thus be considered a good proxy for the 10-year EU yields. Dark and light red shaded areas correspond to the 50 percent and 90 percent confidence intervals, respectively, as defined by risk-neutral probabilities derived from the option prices on 10-year-swap rates. Panel B shows historical and expected real interest rates for 10-year EU debt, based on 10-year euro swaps corrected for the average swap-EU yield spread and market inflation expectations.
Annual costs up to 2058
To project the interest charges that will have to be paid from the EU budget, we combined these interest rate expectations and their volatility with information on the EU stock of debt, projections for future funding needs, the current distribution of debt maturities and spreads between swap rates and EU bond yields (see the annex for details). However, we judge the probability of extreme negative rates (anticipated by the market and resulting from the methodological assumptions of the pricing model) to be exaggerated, and thus we assume that future European rates cannot drop below their historical minimum, ie that 10-year swap rates will not go below their 2020 level of minus 0.33 percent (dashed grey line in Figure 1, Panel A) 2 This assumption is based on the concept of the 'effective lower bound' of monetary policy. It would become challenging for the European Central Bank to set rates lower than the minimum policy rate reached at the time (-0.5 percent), because commercial banks would start storing cash (with an interest rate of 0 percent) to avoid negative rates (see Claeys et al, 2019). Consequently, longer-term rates would also not fall below the level reached at the time. .
Our results show that yearly interest costs could increase to €10.8 billion in 2030 in the baseline trajectory (ie 0.05 percent of expected EU GDP), before decreasing gradually up to 2058. Total interest costs up to 2058 could amount to around €222 billion (ie 0.6 percent of the expected 2021-58 average of EU GDP; see bold numbers in Figure 2). Because of the significant uncertainty about future interest rates, interest costs may vary substantially around baseline estimates. With a 50 percent probability, interest costs could fall within the €8.2 billion to €13.2 billion range in 2030, while the 90 percent confidence interval ranges from €3.9 billion to €
Figure 2: Projected annual and total interest costs borne by the EU
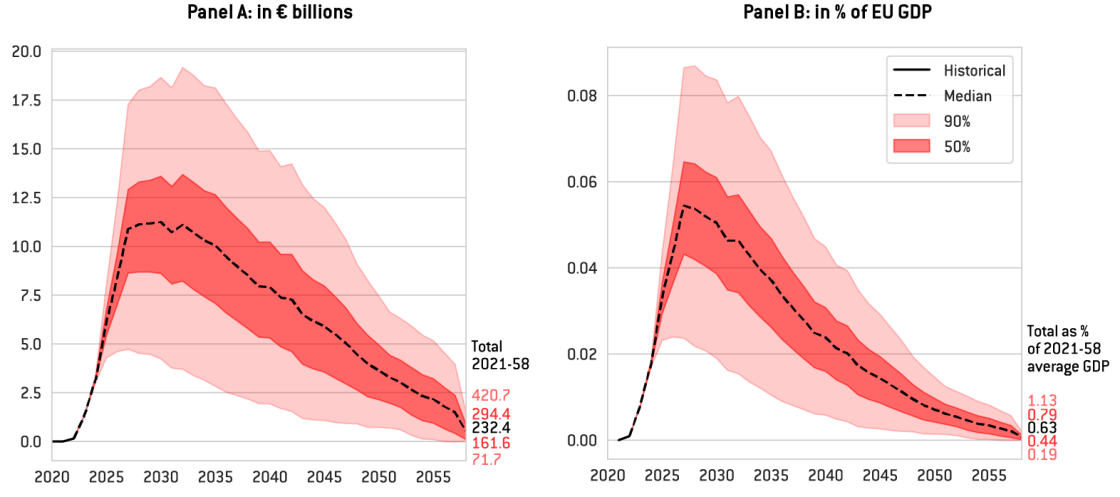
Source: Bruegel based on Danske Bank, Bloomberg and European Commission. Notes: Panel A presents historical and projected annual interest rate costs (lines, LHS) and total costs in 2021-2058 (numbers in bold, RHS) borne by the EU, in current prices. Fifty percent and 90 percent confidence intervals are based on option implied interest rate volatilities (see the annex). Panel B presents the same costs over projected nominal EU GDP, and the estimated share of total costs in 2021-2058 in average annual EU GDP (numbers in bold, RHS).
Starting in 2028, when a new budget cycle begins, the EU budget will also need to include provisions for the repayment of the EU debt, in addition to interest costs. However, the debt issued between 2021 and 2026 will not necessarily need to be reimbursed immediately when it matures, as the legislation allows for some rollover after 2027, to enable a smooth decline in EU debt.
In our simulations, from 2028, we thus assume some rollover to ensure a linear decline in the total debt stock until 2058. From this, we estimate that the annual principal repayments will be around €13.9 billion from 2028 to 2058. Starting in 2028, the EU will thus be required to allocate significantly more money to service its debts. At the 50 percent confidence interval, the total annual financial needs could reach between €22 billion and €27 billion in 2030 (respectively 0.11 percent and 0.13 percent of EU GDP), before declining gradually towards €13.9 billion at the end of the programme. In total, for NGEU non-repayable support to EU countries, between about €582 billion and €715 billion will likely be spent to pay interest and to reimburse the debt (Figure 3, Panels A and B).
However, these amounts, reaching a maximum of 0.15% of GDP for the trajectory at the 95th percentile, would be much lower than a 0.6 percent of GNI temporary increase, decided in 2020, in the amounts the EU can call on from EU countries if needed. This would ensure there is no risk of the EU defaulting on its financial commitments.
Figure 3: Projected annual repayments and interest costs borne by the EU
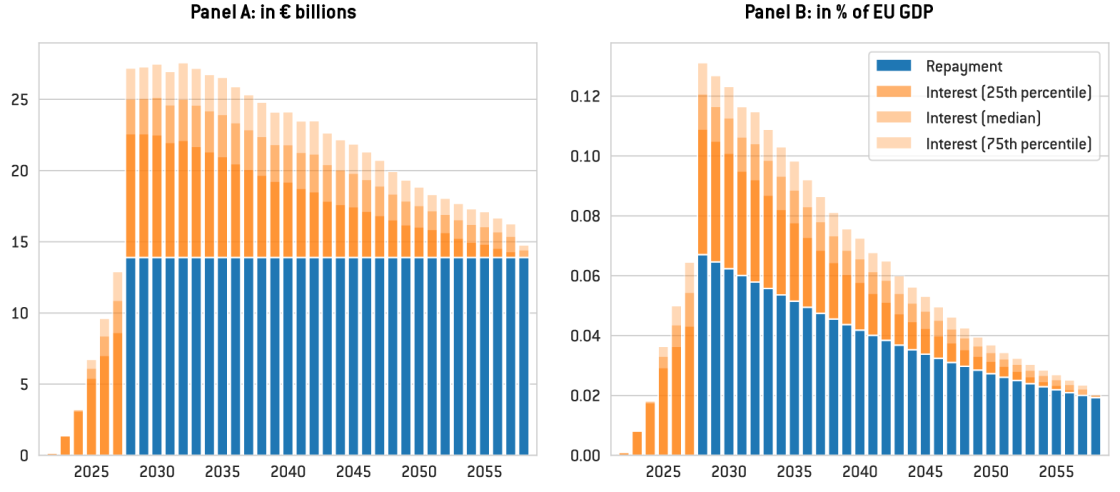
Source: Bruegel based on Danske Bank, Bloomberg and European Commission. Notes: The charts show historical and projected annual interest rate costs (orange) and principal repayments (blue) borne by the EU budget in € billions and in percent of GDP. Percentile estimates are based on option implied interest rate volatilities (see the annex).
Will the EU have sufficient revenues?
In June 2023, the European Commission (2023a) proposed a package of ‘own resources’, or revenues for the EU budget. Under the proposal an estimated €36.5 billion (in 2018 prices) per year would be raised for the EU budget between 2028 and 2030: €19 billion from the EU emissions trading system, €1.5 billion from the carbon border adjustment mechanism (CBAM) 3 See https://taxation-customs.ec.europa.eu/carbon-border-adjustment-mechanis…. and €16 billion from a new statistics-based own resource on company profits. Adjusting for inflation 4 Using historical inflation rates from 2018 to 2022 and inflation forecasts up to 2028 from the April 2023 IMF World Economic Outlook. , this new package would in principle raise approximately €50 billion annually between 2028 and 2030. Given the scarcity of forecasts on carbon prices, carbon emissions, ETS and CBAM coverage, and the current lack of details on the revenues that could be derived from a corporate profits levy, estimating revenues after 2030 is a challenge beyond the scope of this analysis.
However, €50 billion annually could, in theory, be enough to cover the costs associated with NGEU borrowing: our analysis suggests that these costs could peak at €27 billion in 2030 for the 75th percentile trajectory, or €32 billion for the 95th percentile trajectory. This assumes, however, that the Commission’s estimates are realistic and its proposals are approved unchanged. This is unlikely 5 EU countries have already criticised strongly some parts of the proposal. See, for example, Silvia Ellena, ‘EU budget: Member states pull the break on new revenue sources’, Euractiv, 14 July 2023, https://www.euractiv.com/section/economy-jobs/news/eu-budget-member-sta…. . Moreover, there are other calls on ETS revenues (social and innovation funding), which should reduce substantially the amount that could be used to service NGEU debt.
Given that the costs associated with EU borrowing will peak as soon as 2028-2030, it is crucial that a sufficient package of own resources is in place by then. Otherwise, countries must either reduce other EU budget expenditures 6 There is an inconsistency in the way that the EU debt is treated currently in the EU budget. While the share of GNI that could be claimed for the budget was increased in 2020 by 0.6 percent to convince markets that there would be no risk of default on EU debt, debt costs were still put below the expenditure ceiling, meaning other EU budget expenses would need to be cut if EU debt interest was too high. The European Commission seems aware of the problem and has proposed to deal with it by creating a new special instrument above the EU budget expenditure ceilings to cover additional NGEU debt costs (European Commission, 2023e). It is crucial that EU countries adopt this proposal to avoid any cut in the funding other EU programmes. , or increase their national contributions, through a call on the 0.6 percent of GNI guarantee set up in 2020.
References
Claeys, G. C. McCaffrey and L. Welslau (2023a) ‘The rising cost of European Union borrowing and what to do about it’, Policy Brief 12/2023, Bruegel, available at https://www.bruegel.org/policy-brief/rising-cost-european-union-borrowing-and-what-do-about-it
Claeys, G., C. McCaffrey and L. Welslau (2023b) ‘An estimate of the European Union’s long-term borrowing cost bill’, briefing for the European Parliament Budget Committee, available at https://www.europarl.europa.eu/RegData/etudes/BRIE/2023/754286/IPOL_BRI(2023)754286_EN.pdf
Claeys, G., M. Demertzis and F. Papadia (2019) ‘Challenges ahead for the European Central Bank: Navigating in the Dark’, analysis for the European Parliament Economic and Monetary Affairs Committee, available at https://www.europarl.europa.eu/thinktank/en/document/IPOL_IDA(2019)638419
European Commission (2021) ‘Semi-annual report on the execution of the NextGenerationEU funding operations pursuant to Article 12 of Commission Implementing Decision’, Report C(2021)2502, available at https://commission.europa.eu/system/files/2022-02/com_2022_43_1_en_act_part1_v6.pdf
European Commission (2022) ‘Half-yearly report on the implementation of borrowing, debt management and related lending operations pursuant to Article 12 of Commission Implementing Decision’, Report C(2022)9700, available at https://commission.europa.eu/system/files/2023-02/COM_2023_93_F1_REPORT_FROM_COMMISSION_EN.PDF
European Commission (2023a) ‘An adjusted package for the next generation of own resources’, Communication 2023/330, available at https://commission.europa.eu/system/files/2023-06/COM_2023_330_1_EN_ACT_part1_v5.pdf
European Commission (2023b) ‘Funding Plan July-December 2023’, Factsheet, available at https://commission.europa.eu/system/files/2023-07/Factsheet_Funding%20Plan_July-December%202023_modified_10.07.pdf
European Commission (2023c) ‘Report from the Commission to the European Parliament and the Council- Half-yearly report on the implementation of borrowing, debt management and related lending operations pursuant to Article 12 of Commission Implementing Decision C(2022)9700’, Report 2023/461, available at https://eur-lex.europa.eu/legal-content/EN/TXT/?uri=COM%3A2023%3A461%3AFIN&qid=1690541270364
European Commission (2023d) ‘Half-yearly report on the implementation of borrowing, debt management and related lending operations pursuant to Article 12 of Commission Implementing Decision’, Report C(2023)93, available at https://commission.europa.eu/system/files/2023-02/COM_2023_93_F1_REPORT_FROM_COMMISSION_EN.PDF
European Commission (2023e) ‘Communication on the mid-term revision of the Multiannual Financial Framework 2021 – 2027’, COM(2023) 336 final, 20 June 2023, available at: https://commission.europa.eu/system/files/2023-06/COM_2023_336_1_EN_ACT_part1_v4.pdf
Projections of future interest costs and debt issuance that will be borne by the EU are calculated by combining data on the EU’s current debt stock with estimates of future financing needs, the original maturity structure of current debt and market expectations of future interest rates.
For issuance, until the end of 2022, we use European Commission transaction data and press releases to identify historical interest costs for bills and for bonds that should be attributed to the non-repayable part of NGEU (some interest costs of some NGEU bonds are borne directly by EU countries, which are liable for the loans they have taken). Therefore, we adjust the size of historical coupon payments by the non-repayable share of disbursed NGEU funds, as reported in European Commission reports on the implementation of borrowing, debt management and related lending operations (European Commission, 2021, 2022, 2023d).
For the first half of 2023, we adjust issuance levels to account for support for Ukraine, before correcting by the share of non-repayable disbursements as a share of total NGEU disbursements for the first half of the year (calculated based on European Commission, 2023c). Outstanding borrowing needs in 2023 are estimated by applying the share of non-repayable support in total outstanding NGEU support to the NGEU borrowing included in the funding plan announced for the second half of 2023 (European Commission, 2023b). Borrowing needs for the subsequent years are based on estimates for outstanding disbursements of NGEU grants and rollover costs of existing and future debt. Given disbursement request delays and revisions to national recovery plans, these assumptions are challenging. We assume equal disbursement of outstanding non-repayable support until the end of 2024 and equal disbursement of outstanding grants until the end of 2026. As detailed in Claeys et al (2023a), our findings are largely robust to different grant disbursement schedules, but different assumptions will ultimately lead to different results. Until 2027, borrowing needs are met by taking up new debt according to the original maturity profile of the current debt stock.
From 2028, no new debt is issued except for the purposes of rollover. Rollover needs are calculated to ensure a linear decline of total liabilities, resulting in the full repayment of all debt by the end of 2058. During this period, a fixed amount of €10 billion in bills is rolled over annually (corresponding to the rounded average level between 2021 and 2023), with the shares of 3- and 6-month bills mirroring the distribution of the current debt stock. The maturity profile of rolled-over bonds is chosen to ensure full repayment by 2058 and a smooth distribution of rollover needs over time. Specifically, rolled-over bonds are issued according to a linearly declining maturity structure. In each year t, the share s of issued bonds with maturity m can be calculated as:
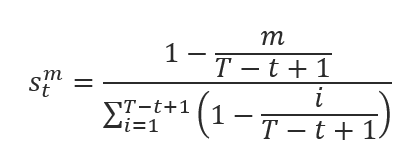
Here, T denotes the final year of repayment. In 2055 for instance, 50 percent of issuance will be allocated to 1-year bonds, around 33 percent percent to 2-year bonds, and around 17 percent to 3-year bonds. Resulting annual rollover amounts are around €22.8 billon from 2029 and 2038, €18.5 billion from 2039 to 2048, and €16.9 billion from 2049 to 2058.
Interest rates are based on forward swap data for each projection year and respective maturities, corrected by the monthly average spread between euro swaps and generic EU bonds, from September 2023. The lower-spread scenario additionally corrects for differences in monthly average EU-Bund spreads between January 2022 and September 2023. We use forwards of 3 months, 6 months, as well as 1-, 2-, 3-, 4-, 5-, 10-, 15-, 20-, 25- and 30-year swaps, correcting each by the spread with respective EU generic bonds and linearly interpolating missing rates along the yield curve.
Fifty percent and 90 percent confidence intervals reflect the volatility consistent with prevailing market expectations. Specifically, the upper and lower bounds for forward rates have been derived from the implied volatilities of option prices for 10-year euro swaps. Given observed pricing parameters, one can solve an option pricing model for the volatility parameter and thus derive the range of expected price swings of the underlying asset. The implied volatilities used in our calculations are based on the proprietary pricing model of Danske Bank (who we thank for providing us with the resulting confidence interval data). We repeat the projection of interest costs described above for each bound. This implicitly assumes a constant shape of future yield curves.
Real GDP projections up to 2027 are based on data by the Output Gaps Working Group of the Economic Policy Committee. Long-term projections are based on interpolated projections of the European Commission 2021 Ageing Report. The corresponding GDP deflator is based on Output Gaps Working Group data up to 2027, market expectations inferred from Bloomberg inflation swap data up to 2053, and the assumption of constant inflation thereafter.
Using historical inflation rates from 2018 to 2022 and inflation forecasts up to 2028 from the April 2023 IMF World Economic Outlook.
EU countries have already criticised strongly some parts of the proposal. See, for example, Silvia Ellena, ‘EU budget: Member states pull the break on new revenue sources’, Euractiv, 14 July 2023, https://www.euractiv.com/section/economy-jobs/news/eu-budget-member-states-pull-the-break-on-new-revenue-sources/.
There is an inconsistency in the way that the EU debt is treated currently in the EU budget. While the share of GNI that could be claimed for the budget was increased in 2020 by 0.6 percent to convince markets that there would be no risk of default on EU debt, debt costs were still put below the expenditure ceiling, meaning other EU budget expenses would need to be cut if EU debt interest was too high. The European Commission seems aware of the problem and has proposed to deal with it by creating a new special instrument above the EU budget expenditure ceilings to cover additional NGEU debt costs (European Commission, 2023e). It is crucial that EU countries adopt this proposal to avoid any cut in the funding other EU programmes.
About the authors
Related content

The EU needs a methodology for including reform impacts in fiscal trajectories
Such a methodology, and a governance mechanism for managing associated risks, must be in place before the new fiscal framework kickstarts in September

Incorporating the impact of social investments and reforms in the European Union’s new fiscal framework
This paper proposes an approach for quantifying the impact of public investments and reforms on debt sustainability

What visions for Europe? Unpacking EU parties’ economic strategies
The EU elections are around the corner. What economic plans are the parties advocating for?

Visions for Europe: Economic expert debate for the 2024 EU elections
Bruegel and the Financial Times partnered up to host a debate featuring representatives from EU political parties on EU economic issues