Chart of the week: US and Europe’s employment recovery: The Missing Engines
Dave Altig from the Atlanta Fed recently compared sectoral employment growth in the US during two recoveries: the 2001 dot-com recession and the 2007 financial crisis. The 45 degree line in the figure helps us understand the relationship between the two recoveries. If industries are aligned along the line, this means that the pace of employment growth was similar over the two periods.
The drag of construction is rather expected and lags greatly behind the 2001/2007 upswing where it contributed greatly to employment growth. The very large drag of government jobs which are not only depressing overall employment but also GDP. Yet the most striking feature of the US recovery is the relatively good standing of manufacturing (ex motor and vehicles) which is somewhat at odds with the narrative of rapidly declining and outsourced industrial base and which a growing number of people describe as “reshoring”. Indeed, the great surprise of this still modest employment recovery is the relatively good standing of the US manufacturing sector.
We performed a similar exercise for the euro area by plotting average quarterly changes in employment between 2001 and 2007 against the same measure for the 2009-2011 period.
Source: Eurostat
Note: The size of the bubbles captures the average share of employment (2002-2007) in each sector relative to total employment.
Construction remains, rather expectedly, the striking outlier. The drop to this day has been twice as strong as the initial increase. This implies that, at this pace, by the end of 2012 employment figures in this sector will have declined below the 2001 level. Public administration is growing marginally while it is declining sharply in the US which contrasts somewhat the narrative about the absence of fiscal consolidation in the US and the severe austerity in Europe. In fact, individual states in the US are tightening policy and firing public sector workers while in Europe spending are being cut but public sector workers’ employment is largely preserved.
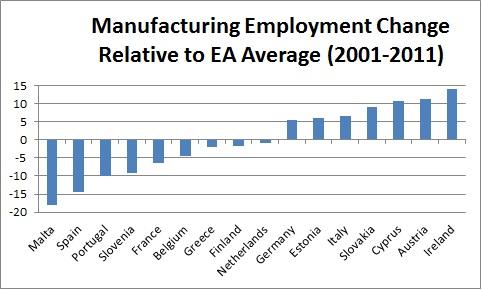
But what is really striking is the fact that almost no sector is above the 45 degrees line and importantly that manufacturing is quite far from its US equivalent. The secular shrinkage of manufacturing, which is evident in the 2001-2007 decline continues at the same pace today. There was therefore no manufacturing crisis in 2009 but rather a continuation of a secular decline and more worryingly the timid signs of “reshoring” that seem visible in the US are not at all visible in Europe. But a quick geographical analysis shows that dispersion for manufacturing employment growth across the euro area is vivid. If there is no reshoring in Europe, there are increasing signs of agglomeration of manufacturing employment in some parts of the continent.
About the authors
Related content
From mutual insurance to fiscal federalism
Almost exactly 25 years ago, the Committee for the study of economic and monetary union was presenting its report to the European Council ou

Enlarging and deepening: giving substance to the European Political Community
The EPC would not be, and should not be, regarded as a substitute for EU accession, but should be designed to work as an accelerator.

Ukraine needs external financial assistance now
Planning Ukraine’s reconstruction tomorrow is important but meeting its financial needs today is more pressing and requires urgent action.
