Yen at war
Talks about currency wars have resurged since the recently elected Japanese Prime Minister Shinzo Abe declared war on deflation, using the heavy armament of fiscal stimulus and monetary easing. His moves have given rise to much controversy; see eg the recent Bruegel blog review and a video interview with Professor Mitsuhiro Fukao from Keio University.
As a result, the yen has depreciated sharply recent weeks. But how do the current yen exchange rates look like in a historical perspective?
Figure 1 shows that even after a sharp recent depreciation of the yen, its rates against some major currencies are not weak compared to the past two decades. The 25 January 2013 rate of 91 against the US dollar is still well below the 111 average rate of 1990-2012. Against the euro, the 122 rate of 25 January 2013 is also below the 135 average rate of the past 23 years. Even the complaints of Korean companies are not well justified: certainly, the yen depreciated against the won by about 22 percent since September 2013, yet the current rate is still more appreciated than any time before September 2008, except the first two months of 1998. (Yet those who engaged in Japanese yen carry trade are certainly happy.)
Figure 1: Japanese yen exchange rates, January 1990 – 25 January 2013
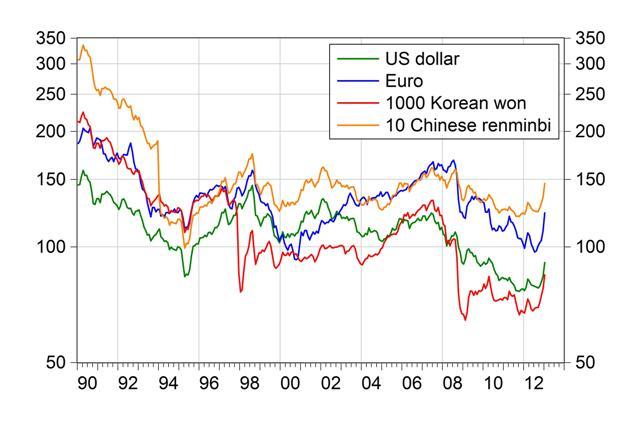
Note: monthly averages up to December 2012; the 25 January 2013 rates for January 2013. A lower value indicates a stronger yen.
Certainly, the real effective exchange rate (REER), which is calculated against several trading partners and controls for the differences in inflation, matters more than the nominal rate. Figure 2 shows consumer prices index based REER developments from 1980 to January 2013. While the most recent value of the Japanese REER is about 10 percent below the average of the past 33 years, the same is true for the US dollar, the Korean won and the Chinese renminbi. Only the euro is almost at the historical average, and its rate may even increase further, since the European Central Bank resists calls for further interest rate cuts and quantitative easing. A stronger euro may weaken the anyway fragile European economic recovery, but even more importantly, it would make the adjustment of external imbalances of Southern euro area members extremely difficult, if not impossible, as I argued in a paper last summer.
Figure 2: CPI-based real effective exchange rates, January 1980 – January 2013 (December 2007=100)
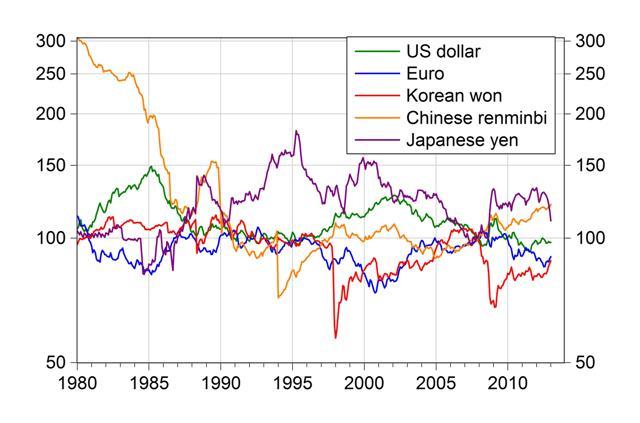
Note: the source for January 1995-January 2013 is the updated dataset of Darvas (2012). We projected the not-yet available consumer price index data by assuming that the 12-month inflation has remained unchanged since the latest available observation. The monthly average exchange rate data for January 2013 is calculated using the actual daily data for 2-23 January 2013 and by assuming that the nominal exchange rates remain unchanged at their 23 January 2013 values till the end of the month. In the pre-1995 period, the OECD’s REER for the US, Euro area, Japan and Korea, and the IMF’s REER for China are chained backward.
About the authors
Related content

Emerging countries have replaced most of Russia’s lost trade with advanced economies
Russian trade overall seems to have suffered little from sanctions; meanwhile, medicine and food trade continues with sanctioning countries

Shinzo Abe’s economic legacy: a glass half full
Abenomics has fallen short in many ways, but Japan has still largely coped with an aging society while maintaining a high level of income equality.

Understanding Japan’s economic relations with China
What can Europe learn?
Sizing up the world's largest trade deal
What should be Europe's strategy towards the Regional Comprehensive Economic Partnership (RCEP)?