Blogs review: The structural balance controversy
What’s at stake: The European Commission has been reconsidering the operational details of its production function method to estimate potential o
What’s at stake: The European Commission has been reconsidering the operational details of its production function method to estimate potential output and structural deficits as several experts drew attention to the implausible results it delivered (especially for structural unemployment or NAWRU). Although the pitfalls of the methodologies used to estimate an economy’s capacity are similar for other institutions like the IMF and the OECD, these methodological problems (such as failing to allow for a non-linearity in wage behavior; or assuming that business cycles are symmetric…) have become especially important in Europe as the European Fiscal Compact, which entered into force on 1 January 2013, requires that the structural deficit for euro-area Member States be less than 0.5%.

The large fluctuations of potential output
Matthew Dalton writes that there is something fundamentally wrong with the way the European Union calculates the “structural balance.” The European Commission uses this metric — the actual government budget balance adjusted for the strength of the economy – to determine how much austerity is needed; getting it wrong has big consequences. Simon Wren-Lewis explains that if the Commission underestimates the output gap because it overestimates the natural rate of unemployment, then it will overestimate the structural budget deficit, and the country concerned will come under considerable pressure to undertake further austerity under the “two pack”.
Erik Klar notes that conventional macroeconomic theory suggests that potential variables should be relatively stable over short- to medium-term horizons, the rationale being that their main determinants are largely independent of business cycles. In stark contrast, however, the EC's econometric estimates of potential growth variables in Europe have been subject to massive revisions since the financial and economic crisis. For the years 2009-2012, the EC tables for the Irish economy display negative potential output growth and revisions of close to four percentage points compared to the 2008 forecast. The figures for other eurozone economies look rather similar. Potential growth in Portugal in 2012 is currently estimated at -1.3 per cent, a fall of 3.2 percentage points compared with the 2008 forecast, while the worst outlook is for Greece, where potential output is projected to continue shrinking all through 2017.
European Commission estimates of potential growth: Ireland
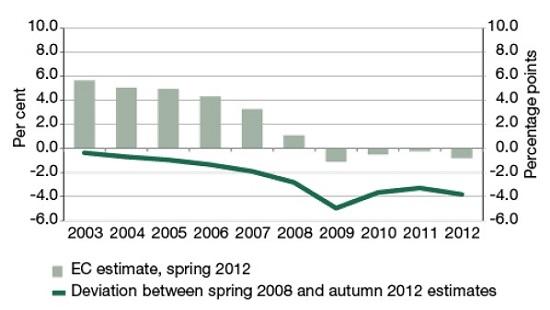
Source: Erik Klar
The failure of standard methods for estimating potential output
Paul Krugman writes that the standard methods for estimating economic potential are working very badly in this slump. These methods automatically interpret any sustained decline in actual output as a decline in potential, and they cause that re-estimate to propagate backward through time. So the catastrophe in Greece ends up producing the basically silly conclusion of a hugely overheated economy before the crisis. As of now, the WEO database has, for example, that Estonia, Greece and Latvia had double digits positive output gaps in 2007. The Irish Fiscal Advisory Council writes that although the European Commission production function approach is based on a model of the supply side of the economy, in practice the production function methodology relies heavily on statistical filtering at a lower level of aggregation and yields similar results than purely statistical methodologies that extract the trend directly from GDP.
Simon Wren-Lewis writes that in principle we can use information on what we observe, like wage inflation, to make inferences about what the natural rate of unemployment is. If wage inflation depends on the gap between actual unemployment and the natural rate, we can switch things around to make this equation tell us what the natural rate is, given observations on actual wage inflation. But if misspecify the wage equation (by for example failing to allow for a non-linearity in wage behavior as in the case of the European Commission), the estimates of the natural rate will be wrong.
John Doe writes that the European Commission previously used a trend/cycle decomposition using a HP filter to get the NAWRU. The well-known "end point" problems associated with this filter then led to the exploration of alternative methodologies, ending up with an Unobserved Components method based on a wage Phillips curve and a Kalman filter approach to estimating the NAWRU.
Matthew Dalton notes that the problems with the commission’s structural balance methodology extend beyond the crisis countries. The commission charitably calculates estimates of the U.S. natural rate as part of its official forecasts. In spring 2013, the commission believed the U.S. natural rate was 8%, despite the fact that the U.S. unemployment rate was 7.6%. Can it be that U.S. unemployment, still higher than at any time in the last 20 years, is below the natural rate? Is the U.S. economy running close to full capacity?
The nitty-gritty details of the Output Gap Working Group
John Doe explains that the Commission does the technical work, and presents it to national delegations at the regular meetings of the "Output Gap Working Group" in Brussels. This "technical" group reports to the EU's Economic Policy Committee, where member states officially decide on matters of policy and methodology. The delegations are invited to question and comment. Many of the delegates do not master these methods, and questions are few and superficial. And so, one step at a time, little by little, we ended up with a "state of the art" method delivering sometimes very improbable results.
Matthew Dalton writes that Senior European Union finance officials have declined to back a change that was approved by technical experts. An article published in The Wall Street Journal generated concern in some national capitals about its effects on budget policies (a commenter notes that this article in the German newspaper FAZ may have played a role). John Tardis Smith writes that the OGWG decided to make an ad hoc change in the application of the methodology for Spain, as the normal computation of the NAWRU for Spain appeared to be so improbable, and Spain is a "large" euro area member state, and Spanish objections prevailed. Simon Wren-Lewis writes that the Commission will thus go on making estimates that it knows are overestimating structural budget deficits, because of ‘concern in some capitals’ about the implications of using better estimates! None of this does the Commission any good in terms of its competence to help determine national fiscal policy.
The asymmetry of business cycles and the return of the “plucking model”
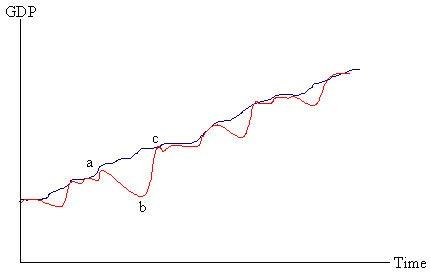
The plucking model
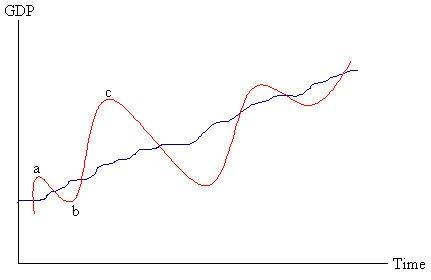
The natural rate model
Source: Mark Thoma
Antonio Fatas writes that our economic models tell us little about producing too much. To describe the pre-crisis years we are telling a story about economic behavior that is unsustainable which will trigger a future adjustment that will have negative consequences in the economy. But it is unclear why this leads to the economy operating above potential before the crisis. The economy has engaged in behavior that is unsustainable and leads to a crisis, that we all agree. But many make the mistake of establishing a one-to-one relationship between an unsustainable level of asset prices or consumption with a level of production that is too high. In an open economy consumption growth can be supported by imports and production abroad leading to a current account deficit. But in terms of the productive capacity of the economy it is unclear why we have gone in anyway above its maximum.
Mark Thoma explains that Milton Friedman's "plucking model" is an interesting alternative to the natural rate of output view of the world. The typical view of business cycles is one where the economy varies around a trend value (the trend can vary over time also). Milton Friedman has a different story. In Friedman's model, output moves along a ceiling value, the full employment value, and is occasionally plucked downward through a negative demand shock. The "plucks" are the deviations of the red line from blue line representing the ceiling/trend: Notice that the size of the downturn from the ceiling from a→b (due to the "pluck") is predictive of the size of the upturn from b→c that follows taking account of the slope of the trend. I didn't show it, but in this model the size of the boom, the movement from b→c, does not predict the size of the subsequent contraction. In a natural rate model, there is no reason to expect such a correlation. Here, the size of the downturn a→b does not predict the size of the subsequent boom b→c. Friedman found the size of a→b predicts b→c supporting the plucking model over the natural rate model.