Export and unit labour cost adjustment: close association in EU15
We have updated, up to 2013Q2, our database on quarterly unit labour cost (ULC) based real effective exchange rate (REER) indices.
We have updated, up to 2013Q2, our database on quarterly unit labour cost (ULC) based real effective exchange rate (REER) indices, which was developed last year in this policy contribution and further elaborated in this working paper (the dataset is freely downloadable from here). The indicators are based on sectoral data and one version of the indicators controls for sectoral changes in the economy. This is important, because sectoral shifts, such as the shrinkage of low labour productivity and the low-wage construction sector, can lead to apparent increased average labour productivity and average wages, especially when capital intensity differs across sectors. Such compositional changes can be good: e.g. it is a benign development if high-productivity sectors grow faster than low-productivity sectors, but quantifying these compositional changes is crucial for assessing the adjustment that countries have achieved.
Also, beyond indicators for the total economy, we also report indicators for the business sector excluding construction, real estate and agriculture: ULC developments in the public sector do not directly affect the international wage competitiveness of the country; construction and real estate activities are highly cyclical; and agriculture is strongly influenced by weather conditions.
The updated dataset indicates many interesting developments. Let me show here a telling chart on the correlation of the ULC-based REER and export performance. Some observers argued that there is a ‘Spanish paradox’ in the sense that Spanish exports are growing very fast since the crisis, which is not in line with REER developments. By taking a cross-country perspective, I do not see any Spanish paradox in my dataset. In a policy contribution on intra-euro rebalancing published last summer I reported a chart on export performance vs REERs for euro area countries before and after 2008Q1, which did not suggest such a paradox. Now I have updated this chart up to 2013Q2 and also added Denmark, Sweden and the United Kingdom, which chart does not show a Spanish paradox either. The good Spanish export performance is in line with the ULC-REER depreciation since 2008Q1, but it was also in line during 2000Q1-2007Q4, as indicated in the figure below.
There is, however, a ‘Greek paradox’ emerging: very weak export performance despite the REER depreciation. One reason could be that REER depreciation was too recent, as suggested by Figure 2 below. Yet this figure also shows that Greek exports developed in line with the weighted average import growth of trading partners in 2002-2008. Since 2009, this relationship has broken down, suggesting that the Greek export capacity may have suffered permanently during recent years.
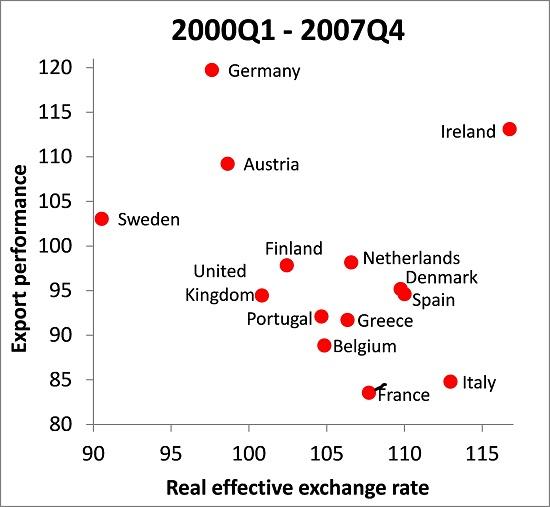
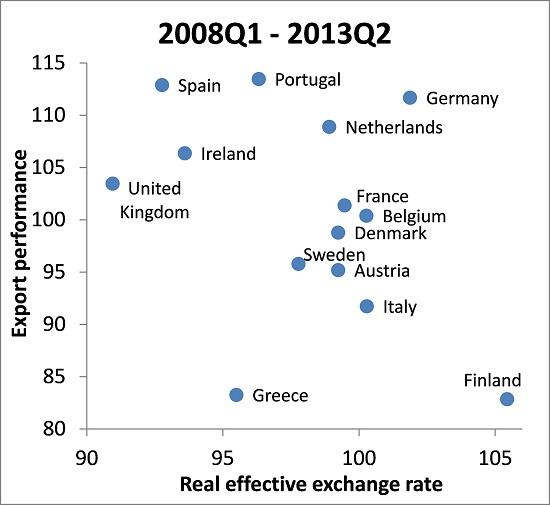
Figure 1: Unit labour cost based real exchange rate vs. export performance, before and after 2008Q1
Source: Updated dataset of Darvas (2012a) for real exchange rates and author’s calculations for export performance using data from Eurostat and national statistical offices. Note: 14 of the EU15 countries (EU members before 2004) are included; Luxembourg is not included due to missing data. An increase in the real exchange rate indicates real appreciation of the ULC-based REER calculated against 30 trading partners: 23 EU countries plus Australia, Canada, Japan, Korea, New Zealand, Norway and the United States (Croatia, Cyprus, Luxembourg, Malta and Romania are not included among the EU countries due to missing data). The REER considers the business sector excluding construction, real estate and agriculture, and was calculated using constant 2008Q1 sectoral weights in order to limit the impact of compositional changes on the REER. See Darvas (2012b) for further details. Export performance is a measure of export market share at constant prices: the ratio of the volume of exports of goods and services to the weighted average volume of imports of goods and services of 40 trading partners, using country-specific weights for each country. The 40 partners include the 30 countries against which the REER-ULC is calculated plus Brazil, Croatia, Cyprus, Iceland, Luxembourg, Malta, Romania, Russia, Switzerland and Ukraine. Export performance is measured as the change from the beginning to the end of the period, ie from 2000Q1 to 2007Q4 (measured as 2000Q1=100) on the left hand panel and from 2008Q1 to 2013Q2 (measured as 2008Q1=100) on the right hand panel. Since REER changes impact export performance with a lag, we relate export performance to the average REER during the period considered, ie the average of 2000Q1-2007Q4 (as 2000Q1=100) on the left hand panel and the average of 2008Q1-2013Q2 (as 2008Q1=100) on the right hand panel.
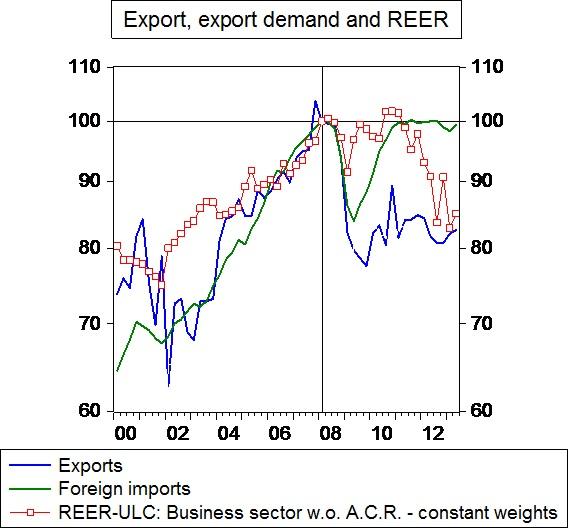
Figure 2: The emerging Greek paradox: weak exports despite REER depreciation
Notes: all indicators expressed as 2008Q1=100. A.C.R. stands for ‘agriculture, construction and real estate activities’. Exports: volume of Greek exports of goods and services. Foreign imports: trade-weighted average of volume of imports of goods and services of 40 trading partners (see their list in the note to the previous chart).
About the authors
Related content

The impact on the European Union of Ukraine’s potential future accession
This report evaluates the impact on the EU of a possible EU accession of Ukraine, focusing on economic consequences and institutional developments.

The EU needs a methodology for including reform impacts in fiscal trajectories
Such a methodology, and a governance mechanism for managing associated risks, must be in place before the new fiscal framework kickstarts in September

Real effective exchange rates for 178 countries: a new database

Emerging countries have replaced most of Russia’s lost trade with advanced economies
Russian trade overall seems to have suffered little from sanctions; meanwhile, medicine and food trade continues with sanctioning countries