A slightly tighter ECB
The ECB’s recent decision on QE was somewhat on the dovish side. Francesco Papadia gives his view on why it is time to start a discussion about reduci

In a recent TV interview, I said that I was a bit surprised by the ECB’s dovish decision on QE, announced at the last press conference, and that I thought the ECB could have been a little slightly tighter. In this short post I illustrate the five main reasons behind my view, which are also relevant when thinking about the ECB’s next moves.
First, as shown in table 1, for three years now growth in the euro area has been about double the estimated growth potential[1]. This is expected to last for another two years at least. Notwithstanding all the uncertainties about real time measurement of slack, this will inevitably have an effect on wages and inflation. Of course the Phillips curve has empirically flattened a lot recently, but any view that this should be a permanent state of affairs must take into account that the expectation augmented Phillips curve has some very solid theoretical reasoning behind it. Basically the idea is that, as demand for a good (labour) goes up (because of lower unemployment) its price (wages) should also go up. Various factors impinge on the actual strength and timing of this relationship, but we should not expect them to mute it permanently.
The second factor confirms the first one, just mentioned: as it can be seen in figure 1, unemployment came down and the participation rate went up in the euro area, hence employment went up even more.
Figure 1. Unemployment, employment and participation rates (2012-2017)
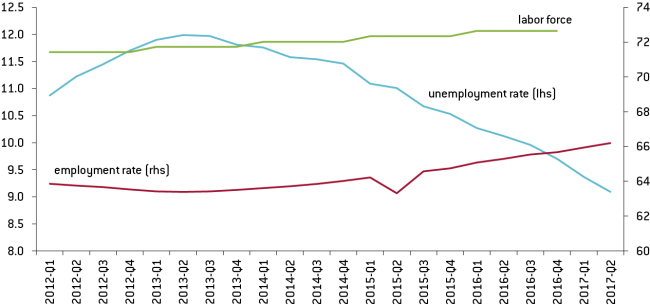
Source: OECD (2017). Unemployment rate (indicator). doi: 10.1787/997c8750-en; OECD (2017), Employment rate (indicator). doi: 10.1787/1de68a9b-en; Labour force participation rate (indicator). doi: 10.1787/8a801325-en
The improvement in the labour market is probably even more visible looking at absolute figures. As shown in table 2, between the beginning of 2013 and the second quarter of 2017 unemployment was reduced by 5.3 million people in the euro area. But employment grew by 7.8 million people because, over the same period, the labour force increased by nearly 2.5 million people.
Third, the banking sector is on the mend, especially in the periphery of the euro area, which was the region with worst macroeconomic conditions.
This is clearly visible in the improvement in the supply of bank loans, in turn manifested by their lower price and their increased quantity: only a positive shift of the supply curve can generate this kind of configuration.
A first evidence of this is in Figure 2, reporting the price of bank loans as measured by the spread, or mark-up, between the cost of loans and the remuneration of bank deposits.
This measure of the cost of bank loans has come down by nearly a quarter between 2014 and now (from about 2.3 to about 1.8 %).
At the same time, as shown in Figure 3, the quantity of bank loans to corporates, the item which had suffered most during the Great Recession in the euro area, has gone up. It has now been in positive, albeit moderate, territory since the end of 2014.
Figure 3. Loans to corporations.
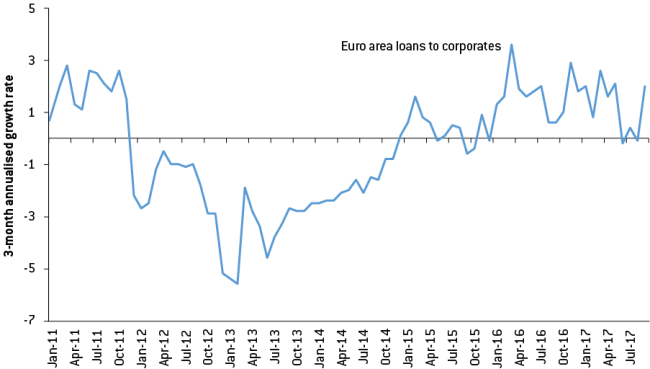
Source: ECB SDW
What is even more interesting is that the improvement in the supply of bank loans has been strongest in the periphery. Indeed, figure 4 shows that, since the beginning of 2014, the cost of bank loans, again as mark-up over the remuneration of deposits, has about halved in Italy and Spain, while recording much lower decreases in Germany and France.
Figure 4. Spread between lending and deposit rate in selected €-area countries (2014–2017).
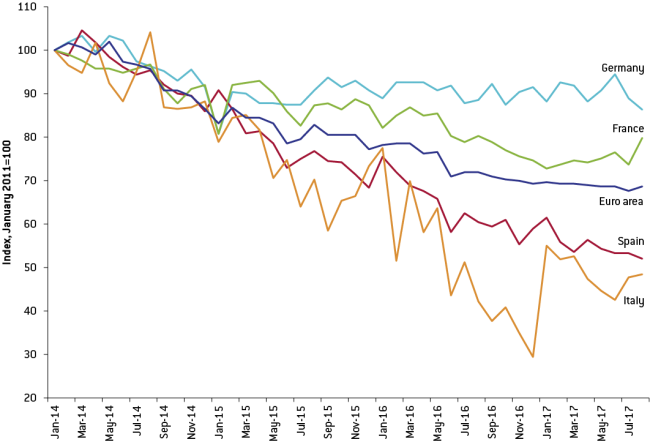
Source: ECB SDW
A zoom on Spain and Germany, in figure 5, throws the phenomenon in sharper relief: while the cost of bank loans was about twice as high in Spain as in Germany in 2014, it is now at the same level.
Also the quantities, reported in figure 6, show that the improvement in the bank supply since 2013-2014 has been much larger in the periphery than in the core.
Figure 6. Growth in bank lending in selected €-area countries (2004–2017).
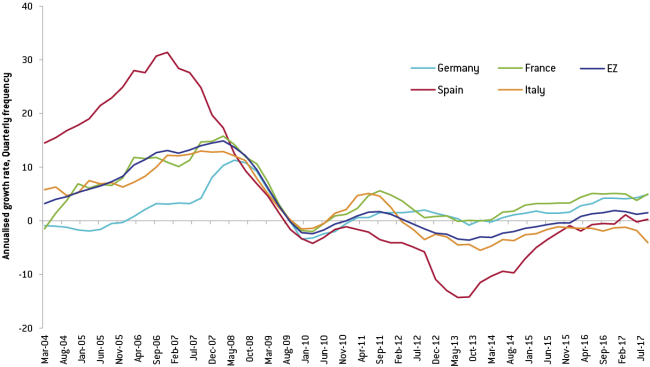
Source: ECB SDW
Developments in non-performing loans indicate a clear improvement in the situation of banks, in particular in the euro-area periphery, as shown by Figures 7 and 8.
Indeed Figure 6 shows that in the aggregate euro area the NPL ratio came down between 2014 and 2017 from 6.5% to less than 4.0%.
Figure 8. Ratio of non‐performing loans and advances (NPL ratio) in the core and the periphery of the euro area.
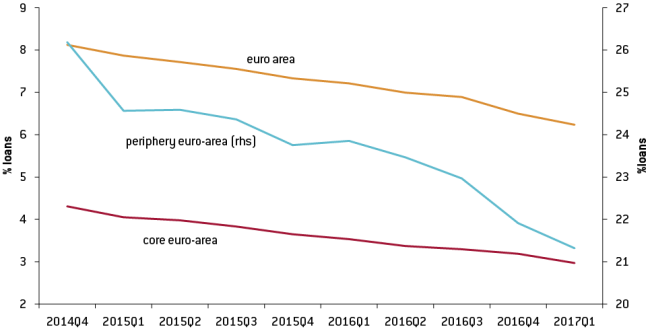
Source: ECB Statistical Data Warehouse. Note: Gross non-performing loans and advances [% of total gross loans and advances]. Periphery euro area includes countries most affected by the financial crisis, i.e. Cyprus, Greece, Ireland, Italy, Portugal, Slovenia, Spain.
Figure 8 shows that most of the improvement was achieved in the periphery, where the ratio came down from about 26% to 21%, while in the core, where it was much lower to start with, it came down by just one percentage point from about 4% to 3%.
Fourth the ECB avails itself, since sometime around 2007, of an interpretation of inflation more consistent with the “large country” model rather that the “small country” model. In the former, the labour market is the ultimate source of inflation, in the latter the exchange rate is the dominating variable. This is visible in Figure 9 which reports the frequency of terms in the speeches of the President and the Vice President of the ECB that are consistent with the small country model (such as exchange rate or global inflation) relative to the frequency of terms consistent with the large country model (such as Phillips curve or labour market). As it can be seen, the relative frequency of “small country” terms came significantly down from Duisenberg to Draghi, with the move from more to less frequent happening during Trichet’s tenure.
Figure 9. Ratio of frequency of terms consistent with the small and the large country approach. ECB 1999-2016.
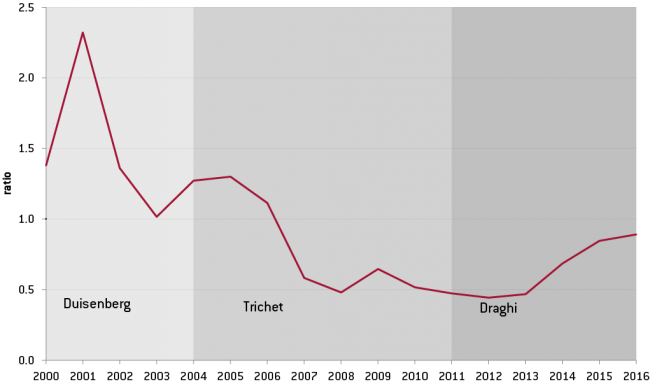
Source: Authors’ elaboration. Moving average (over 2 periods). Note: terms used to indicate small country approach are exchange rate, pass through, imported inflation and import price, global slack, and oil and food price. The large country approach has been identified through the terms: Phillips curve, domestic and economic slack, unemployment, wage and unit labour cost, labour market.
This means that, in ECB monetary policy deliberations, the relative weight of improving conditions in the labour market is now more important than an exchange rate appreciation.
Fifth, and finally, a factor to do with dynamics within the Governing Council of the ECB rather than with underlying economic developments has to be mentioned. The Bundesbank President, Weidmann, has a prospect of succeeding Draghi when he will step down in two years’ time. However, his prospects to get Draghi’s job depend on him not being always in a strident hawkish minority: it would be objectively difficult to nominate as President someone who is always two standard deviations away from the median voter in the Governing Council! This is one of the reasons, not the most important but not a trivial one either, why he has so far tolerated the very accommodative policy of the ECB, with quite limited visible opposition. However, there must be a limit to his willingness to accommodate expansionary policies and it is not in the interest of the majority of the Council to provoke him, and his allies on the hawkish side, into a more vocal opposition, also having in mind public opinion in Germany, which is always ready to take on the ECB.
In conclusion, my mild surprise at the dovish tone of the last ECB press conference is based on both economic factors and my guesses about dynamics in the Governing Council. I believe that, based on good data, it makes sense to now start a discussion about reducing the degree of ease of monetary policy, albeit not for the immediate future. I also think that the recent extension was the last significant instalment of QE, with a short taper towards 0 in the last quarter of 2018 and a move towards 0 for the deposit rate facility in the first half of 2019.
This post was written with the assistance of Alessandra Marcelletti and Madalina Norocea.
[1] Peter Praet, Lifting potential growth in the euro area. Speech by Member of the Executive Board of the ECB, at the Welt-Währungskonferenz, Berlin, 23 April 2015: “International institutions currently estimate the potential growth rate to be below 1% in the euro area… as …Average of IMF, Commission and OECD estimates.”
About the authors
Related content

The European Central Bank’s timid operational framework update
The European Central Bank announced limited changes to its operational framework – which is probably right given current uncertainty

Central banks: uncertainty is the problem, not managing the trilemma
Regaining price stability is difficult but doable; the bigger problem facing central banks is economic uncertainty.

The European Central Bank’s latest move tells a clear story
The European Central Bank is right not to over-react to recent banking problems.

Don’t look only to Brussels to increase the supply of safe assets in the European Union
A sufficient supply of safe assets denominated in euros is critical if the European Union is to achieve a full banking and capital markets union.